
Customer Support Team Monitoring: Efficiency Metrics, Ticket Tracking & Agent Productivity Guide
Customer support team monitoring is the practice of tracking agent activity, response times, ticket throughput, and tool usage to measure and improve help desk performance. For support managers overseeing distributed teams, monitoring provides the data foundation for staffing decisions, coaching conversations, and SLA compliance. This guide covers the specific KPIs, benchmarks, and monitoring workflows that separate high-performing support operations from reactive ones.
Why Customer Support Teams Need Dedicated Monitoring
Customer support is one of the most metric-driven functions in any organization, yet many teams still rely on help desk reports alone to assess agent performance. Help desk data tells you what happened (ticket volume, CSAT scores, resolution counts). It does not tell you how agents spend their time between tickets, where workflow bottlenecks hide, or which agents struggle with specific issue types.
That gap is expensive. The average cost of a single customer support interaction is $2.70 to $6.10 for phone, $8.01 for email, and $1.00 for chat (Forrester Research, 2024). When agents spend 30% of their shift on non-support activities, or when idle time between tickets stretches past 5 minutes on average, those costs compound quickly across a 50-agent team.
But how does activity-level monitoring fill the gap that help desk analytics leave open?
Support team monitoring through a platform like eMonitor captures what happens outside the ticketing system. It records time spent in Zendesk versus Slack versus email versus internal wikis. It identifies agents who spend 45 minutes researching a single tier-1 question that others resolve in 8 minutes. It reveals that your Tuesday afternoon SLA breaches correlate with a 40% drop in active help desk usage between 1:00 PM and 2:30 PM. These patterns are invisible to ticket-level reporting but directly visible through activity monitoring.
Essential Customer Support Team Monitoring Efficiency Metrics
Effective support team monitoring starts with selecting the right KPIs. Not every metric deserves a dashboard widget. The following five metrics form the core measurement framework for support operations, based on MetricNet's 2025 benchmarks across 1,800 help desk organizations.
1. First Response Time (FRT)
First response time measures the elapsed minutes between a customer submitting a ticket and an agent sending the first substantive reply. MetricNet's benchmark for top-quartile teams is under 1 hour for email and under 30 seconds for live chat. eMonitor contributes to FRT optimization by showing managers exactly when agents are active in the ticketing platform versus occupied with other tasks. If your FRT spikes every day at 10:00 AM, monitoring data might reveal that three agents attend a standup meeting from 9:45 to 10:15, leaving the queue understaffed.
2. Average Handle Time (AHT)
Average handle time is the total time an agent spends actively working a single ticket, from initial response through resolution. The 2025 MetricNet benchmark for top-performing support teams is 6.3 minutes for phone, 4.5 minutes for chat, and 12 minutes for email. AHT measured through the ticketing system alone includes queue wait time and customer response delays. Activity monitoring isolates the agent's actual working time, providing a more accurate AHT by excluding periods when the ticket sits idle waiting for customer input.
3. First Contact Resolution Rate (FCR)
First contact resolution rate represents the percentage of tickets resolved in a single interaction without escalation or follow-up. Top-quartile support teams achieve 74% FCR or higher (MetricNet, 2025). Low FCR often indicates knowledge gaps. Monitoring data reveals which agents repeatedly switch between the ticketing tool and internal knowledge bases during simple ticket types, signaling a training opportunity rather than a performance problem.
4. Agent Utilization Rate
Agent utilization measures the percentage of an agent's scheduled time spent on direct support activities (handling tickets, live chat, phone calls) versus indirect activities (meetings, training, breaks, idle time). The healthy range is 70% to 85%. eMonitor calculates utilization automatically by comparing active time in support applications to total scheduled hours. Utilization below 70% across a team usually indicates overstaffing or poor ticket distribution. Utilization above 85% consistently correlates with burnout, as documented in the Harvard Business Review's 2024 analysis of contact center attrition.
5. Customer Satisfaction Score (CSAT)
CSAT is the outcome metric that validates whether your operational metrics translate to customer value. The industry average sits at 78%, with top performers reaching 90%+ (Zendesk CX Trends Report, 2025). CSAT alone does not explain root causes, but when combined with monitoring data, patterns emerge. A team with high utilization but declining CSAT may be rushing through tickets. An agent with the lowest AHT but lowest CSAT may be closing tickets prematurely.
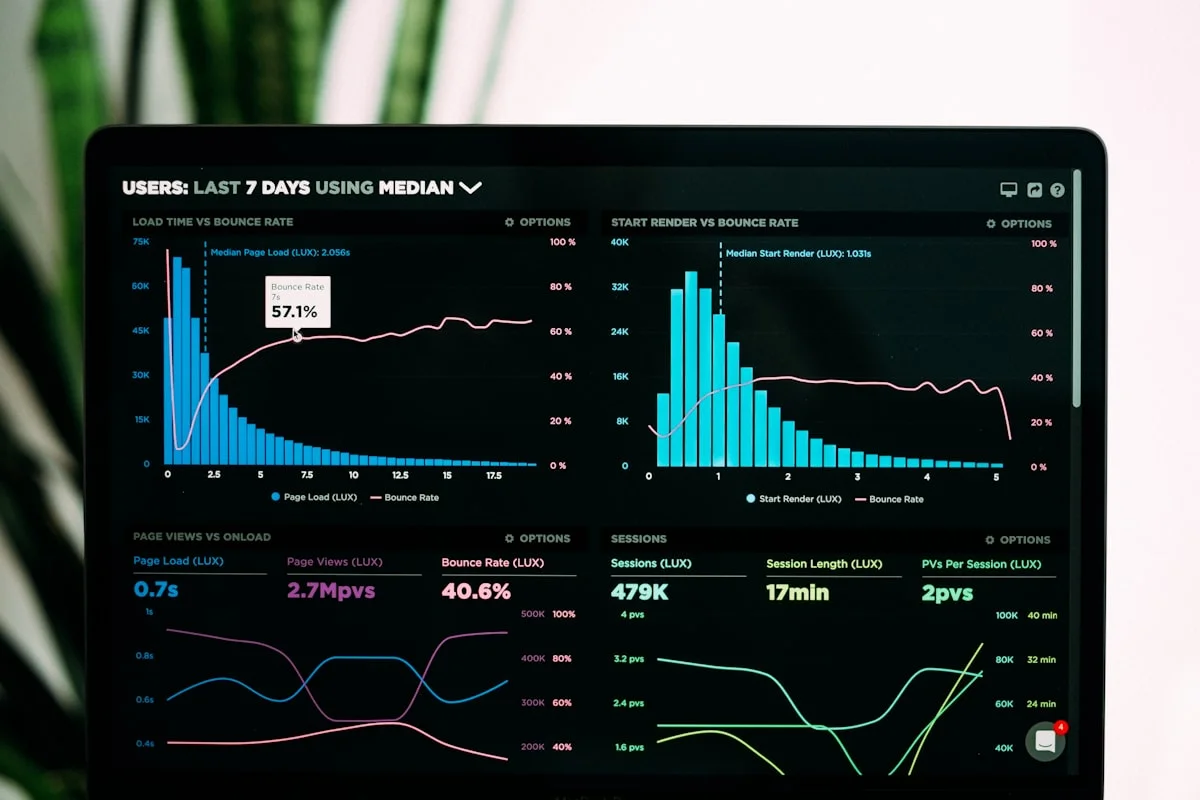
Team Productivity — This Week
Productive hours / day
Activity mix
▲ Deep-focus time up 19% after protecting daily focus blocks.
Illustrative eMonitor dashboard.
How to Track Ticket Resolution Time With Activity Monitoring
Ticket resolution time as reported by help desk software measures wall-clock time: the gap between ticket creation and ticket closure. This metric is useful but misleading. A ticket open for 4 hours may contain only 12 minutes of actual agent work, with the rest spent waiting for customer replies, internal escalations, or queue reassignment.
But how does activity monitoring separate actual agent effort from passive wait time?
eMonitor tracks application-level activity in real time. When an agent opens a ticket in Freshdesk, eMonitor records that the agent is actively working in Freshdesk. When the agent switches to a knowledge base article, that context switch is logged. When the agent goes idle for 3 minutes, the idle period is captured separately. The result is a true "agent effort time" metric that strips away all passive waiting periods.
This distinction matters for two reasons. First, it gives managers an accurate picture of agent workload. An agent who resolves 15 tickets per shift at 8 minutes of effort each is working 2 hours of direct support time, not the 8-hour shift the wall-clock metric implies. Second, it identifies process inefficiencies. If agents spend an average of 6 minutes searching the knowledge base per ticket, that signals either a poorly organized knowledge base or incomplete documentation for common issues.
Building a Ticket-to-Activity Correlation Workflow
The most effective approach combines help desk data with activity monitoring data in a side-by-side review. Export your Zendesk or Freshdesk ticket report showing resolution times, then cross-reference with eMonitor's application usage timeline for the same period. You will identify tickets where the wall-clock time was 2 hours but agent effort was only 9 minutes (acceptable), versus tickets where agent effort was 45 minutes on a tier-1 issue (coaching opportunity).
Support Team Productivity Tracking: Beyond Tickets Per Hour
Tickets per hour is the most common support productivity metric, and it is also the most misleading. A password reset takes 90 seconds. A billing dispute investigation takes 35 minutes. Measuring both agents by the same "tickets per hour" standard penalizes the agent handling complex issues and rewards the agent cherry-picking simple ones.
Effective support team productivity tracking requires a multi-dimensional approach. eMonitor provides the activity layer that makes this possible.
Time Allocation Analysis
eMonitor's application tracking shows exactly how each agent distributes their working hours. A well-balanced support agent's day might look like this: 65% in the ticketing platform, 10% in the knowledge base, 8% in Slack or Teams for internal collaboration, 7% in email, and 10% on breaks and personal time. When an agent's profile shows only 40% ticketing time and 25% Slack time, the imbalance signals either a process issue (too many internal escalations requiring chat coordination) or a time management issue worth addressing in a one-on-one.
Active vs. Idle Time Patterns
Idle time in a support context is not inherently negative. Brief idle periods between tickets allow agents to reset mentally, review notes, and prepare for the next interaction. The concern arises when idle gaps exceed 5 minutes on average or when idle time concentrates in specific time blocks, suggesting staffing mismatches. eMonitor's idle detection, configurable to your team's thresholds, flags these patterns without requiring managers to manually audit timelines.

Context Switching Frequency
Research from the University of California, Irvine, found that it takes an average of 23 minutes and 15 seconds to fully regain focus after a context switch (Mark, Gonzalez, and Harris, 2005). In a support environment, some context switching is unavoidable: agents move between the ticketing tool, knowledge base, CRM, and communication platforms. But excessive switching, more than 15 application transitions per hour, indicates either a fragmented tool stack or an agent struggling to find information efficiently. eMonitor's activity logs capture every application switch, making it possible to calculate switch frequency per agent and per shift.
How to Reduce Support Team Idle Time Without Burning Out Agents
Idle time reduction is one of the most requested outcomes from support managers considering activity monitoring. The goal is not to eliminate every second of downtime. The goal is to identify structural idle patterns that indicate process or staffing issues, then address the root cause.
But when does idle time indicate a real problem versus a natural workflow gap?
eMonitor's idle detection tracks keyboard and mouse inactivity at configurable thresholds (the default is 3 minutes). For support teams, we recommend setting the threshold at 5 minutes, since brief mental breaks between emotionally demanding customer interactions protect agent wellbeing and sustain quality over a full shift.
Common Idle Time Root Causes in Support Teams
- Uneven ticket distribution: When auto-routing sends 60% of tickets to 3 agents while 7 others wait, idle time concentrates on the underutilized group. Monitoring data quantifies the imbalance so routing rules can be adjusted.
- Knowledge base gaps: Agents who encounter unfamiliar issues may sit idle while waiting for a senior agent's response. Monitoring reveals which ticket categories coincide with the longest idle-to-active transitions.
- Shift overlap without queue demand: Two shifts overlapping by 30 minutes doubles agent count while ticket volume remains constant. Historical activity data identifies whether overlap periods produce idle spikes.
- Post-interaction wrap-up delays: Some agents take 8 minutes of wrap-up time after a 5-minute call. Others finish in 90 seconds. Monitoring normalizes this comparison so coaching targets the outliers.
Practical Idle Time Reduction Strategies
Assign secondary tasks for low-volume periods. Agents who would otherwise sit idle can update knowledge base articles, review canned response templates, or complete product training modules. eMonitor's activity data validates that these secondary tasks actually happen during idle windows rather than displacing primary support work.
Teams that implement structured idle time management based on monitoring data typically see 15% to 20% improvement in agent utilization within the first 60 days (Gartner, 2025), without increasing workload or triggering burnout indicators.

See Your Support Team's Real Productivity Data
eMonitor shows you exactly how agents spend their time, from ticket handling to tool usage to idle gaps. Get your baseline in one week.
Customer Support Team Monitoring Benchmarks by Channel
Benchmarking your team against industry standards provides context for internal metrics. The following table compiles 2025 benchmarks from MetricNet, Zendesk, and Forrester Research across the three primary support channels.
| Metric | Phone | Live Chat | Email / Ticket |
|---|---|---|---|
| First response time | 20 seconds (queue wait) | 30 seconds | Under 1 hour |
| Average handle time | 6.3 minutes | 4.5 minutes | 12 minutes |
| First contact resolution | 72% | 68% | 74% |
| Agent utilization (target) | 75-85% | 70-80% | 70-85% |
| Cost per contact | $2.70 - $6.10 | $1.00 - $2.50 | $4.00 - $8.01 |
| CSAT (top quartile) | 85%+ | 82%+ | 80%+ |
| Tickets per agent per day | 40-60 | 50-70 | 25-40 |
| Occupancy rate | 80-88% | 75-85% | 70-80% |
These benchmarks represent top-quartile performance. If your team falls in the bottom quartile on any metric, activity monitoring data from eMonitor helps you identify whether the root cause is staffing, training, tooling, or process design.
Using Monitoring Data to Optimize Support Shift Scheduling
Support team scheduling is one of the highest-impact applications of activity monitoring data. Most support managers build schedules based on ticket volume forecasts from the help desk. Activity monitoring adds a second data layer: when agents are actually productive versus when they are present but underutilized.
eMonitor's attendance tracking and activity heatmaps reveal patterns that ticket data alone misses. You might discover that your 7:00 AM to 8:00 AM shift produces high ticket volume but low resolution rates because the early-shift agents handle fewer issue types. Or that your 2:00 PM to 4:00 PM window shows 90% agent utilization on Mondays but only 55% on Wednesdays, suggesting a mid-week scheduling reduction.
Data-Driven Scheduling in Practice
A 75-agent support operation serving SaaS customers reduced SLA breaches by 31% after implementing schedule adjustments based on three weeks of eMonitor activity data. The key finding: their 11:00 AM to 1:00 PM peak period had only 60% of the agents allocated to the 9:00 AM to 11:00 AM window, despite handling 40% more tickets. Redistributing four agents from the morning block to the midday block eliminated the coverage gap without adding headcount.
Gartner's 2025 research on contact center workforce management confirms this pattern: organizations using activity data alongside volume data for scheduling report 22% fewer SLA violations and 18% lower overtime costs compared to volume-only scheduling.
Identifying Training Needs Through Support Agent Monitoring Data
Traditional support coaching relies on random ticket reviews and customer satisfaction surveys. Both are lagging indicators that catch problems weeks after they develop. Activity monitoring provides leading indicators: behavioral patterns that predict performance issues before they affect customer experience.
But how do you distinguish a training gap from a workflow inefficiency using monitoring data?
eMonitor's activity timelines expose three patterns that consistently indicate training needs rather than motivation issues.
Pattern 1: Excessive Knowledge Base Time
When an agent spends more than 30% of their active time in internal documentation for ticket types that other agents handle in 5 minutes, the issue is knowledge, not effort. The agent is working hard but lacks the product expertise to resolve issues from memory. Targeted training on the specific product areas where knowledge base dependence is highest resolves this pattern within 2 to 4 weeks.
Pattern 2: Escalation-Heavy Application Switching
An agent who frequently switches from the ticketing tool to Slack or Teams to ask colleagues for help is either handling issues above their skill tier or missing training on resolution procedures. eMonitor's application switching data, cross-referenced with ticket complexity, isolates which scenario applies.
Pattern 3: Declining Throughput Without External Cause
When an agent's daily ticket count drops by 20% or more over two weeks without a corresponding increase in ticket complexity, monitoring data reveals whether the decline stems from increased idle time (potential disengagement), longer handle times (possible knowledge decay), or more time in non-support applications (process or focus issue). Each root cause requires a different coaching approach.
Support teams that use monitoring data for targeted coaching reduce average handle time by 12% to 18% within 60 days and see first contact resolution rates improve by 8 to 11 percentage points (ICMI Contact Center Research, 2025).
Monitoring Support Teams Transparently: Privacy and Trust
Support agents are among the most monitored workers in any organization, even before dedicated activity monitoring enters the picture. Call recordings, ticket audits, QA scoring, and CSAT surveys already create layers of performance scrutiny. Adding activity monitoring without addressing the trust dynamic risks increasing attrition in a role that already experiences 30% to 45% annual turnover (SHRM, 2025).
eMonitor's approach to support team monitoring prioritizes transparency by design.
Employee-Visible Dashboards
Every agent sees their own productivity data: active time, idle time, application usage, and utilization rate. When employees can see the same data their manager sees, the monitoring relationship shifts from oversight to shared visibility. Agents use this data to self-correct idle patterns, track their own improvement, and advocate for workload adjustments with evidence rather than anecdotes.
Work-Hours-Only Tracking
eMonitor captures activity only during scheduled work hours. Before clock-in and after clock-out, the system records nothing. Break periods are excluded from productivity calculations. This boundary addresses the most common agent concern: "Are they watching me all the time?" The answer is no, and the system architecture enforces that boundary.

When Monitoring Is Not the Right Approach
We should be honest: activity monitoring is not the right tool for every support team challenge. If your primary issue is low morale or high turnover, adding monitoring without first addressing compensation, workload, and management practices will worsen the situation. Monitoring works best as an optimization tool for teams that already have a functional management culture and need better data to fine-tune performance.
How to Implement Support Team Monitoring in 5 Steps
Rolling out activity monitoring for a customer support team requires a different communication approach than a general office deployment. Support agents are accustomed to performance measurement, but they are also sensitive to tools that feel like micromanagement layered on top of existing QA programs.
- Define your monitoring objectives in writing. Are you solving for idle time, schedule optimization, training identification, or all three? Document the specific questions you want monitoring data to answer. Share this document with the team before deployment.
- Configure eMonitor for support-specific tracking. Classify your help desk platform, knowledge base, and CRM as "productive" applications. Classify social media and personal browsing as "non-productive." Mark communication tools like Slack and Teams as "neutral" since they serve both work and personal purposes in a support context.
- Run a 2-week baseline period without policy changes. Collect data before making any scheduling or performance adjustments. This baseline establishes your current state and prevents premature conclusions from a single week's data.
- Share aggregate findings with the team. Present team-level data (not individual names) in your first review. "Our team averages 68% utilization during morning shifts and 81% during afternoon shifts" is constructive. Individual-level data enters coaching conversations privately.
- Adjust one variable at a time. If the data suggests both a scheduling change and a training initiative, implement the scheduling change first and measure its impact over 2 weeks before layering on the training program. Changing multiple variables simultaneously makes it impossible to attribute improvements to specific interventions.
eMonitor deploys in under 2 minutes per workstation. Most support teams complete full rollout within a single shift and see initial baseline data within the first full work week.
What Support Teams Achieve With Monitoring Data
The practical impact of support team monitoring depends on the starting point. Teams with mature processes and strong management see incremental improvements of 8% to 12% in key metrics. Teams with undiscovered inefficiencies often see larger gains in the first 90 days.
A 120-agent BPO support operation used eMonitor's activity data to discover that agents averaged only 58% utilization during their scheduled hours, well below the 75% target. The root cause was a ticket routing configuration that sent 70% of chat volume to a small pool of "chat-certified" agents while the remaining agents waited for email tickets that arrived in waves. Rebalancing the routing rules across the full team raised average utilization to 74% within three weeks, equivalent to recovering the productive capacity of 19 full-time agents without hiring anyone.
eMonitor is trusted by 1,000+ companies and rated 4.8/5 on Capterra (57 reviews). Plans start at $4.50 per user per month, making it accessible for support teams of any size.
Customer Support Team Monitoring FAQ
How do you monitor customer support team productivity?
eMonitor tracks support agent productivity by recording active time in help desk tools, idle periods between tickets, application switching patterns, and total handle time per interaction. Managers see real-time dashboards showing each agent's utilization rate, ticket throughput, and time allocation across support channels.
What KPIs matter most for customer support teams?
The five essential support KPIs are first response time, average handle time, first contact resolution rate, agent utilization rate, and customer satisfaction score. Industry benchmarks from MetricNet place top-performing teams at under 1 hour first response, 6.3 minutes average handle time, and 74% or higher first contact resolution.
Can monitoring software track ticket resolution time?
eMonitor tracks time spent in ticketing platforms like Zendesk, Freshdesk, and Intercom at the application level. By measuring active time within these tools versus idle or off-task periods, managers calculate true resolution time per agent, not just the timestamp difference between ticket open and close.
How do you reduce idle time on a support team?
eMonitor identifies idle gaps between tickets by tracking periods of keyboard and mouse inactivity. Managers use this data to adjust ticket routing, rebalance queues during low-volume hours, and assign secondary tasks like knowledge base updates. Teams that address idle time patterns typically improve agent utilization by 15 to 20 percent.
What is a good agent utilization rate for customer support?
A healthy agent utilization rate ranges from 70% to 85%, according to MetricNet benchmarks. Below 70% signals overstaffing or poor ticket routing. Above 85% correlates with increased burnout and higher error rates. eMonitor calculates utilization automatically by comparing active support time to total scheduled hours.
How does support team monitoring differ from general employee monitoring?
Support team monitoring focuses on channel-specific metrics: handle time, queue wait, first contact resolution, and tool usage across help desk platforms. General monitoring tracks broader productivity signals. eMonitor supports both approaches, allowing managers to configure support-specific dashboards alongside company-wide productivity views.
Does monitoring help with support team scheduling and shift coverage?
eMonitor's attendance and activity data reveals peak ticket volume hours, average response times by shift, and coverage gaps. Managers use this historical data to build evidence-based schedules. Teams using data-driven scheduling report 22% fewer missed SLA targets during high-volume periods (Gartner, 2025).
Can monitoring data identify support agents who need additional training?
eMonitor highlights agents with above-average handle times, low first contact resolution rates, or excessive application switching during ticket handling. These patterns often indicate knowledge gaps rather than performance issues. Targeted coaching based on monitoring data reduces average handle time by 12 to 18 percent within 60 days.
Is it legal to monitor customer support team activity?
In the United States, the Electronic Communications Privacy Act permits employer monitoring of work systems with employee notice. GDPR requires a legitimate interest assessment and employee notification in Europe. eMonitor supports transparent monitoring with employee-visible dashboards, satisfying both US and EU compliance requirements.
How quickly can a support team implement monitoring?
eMonitor deploys in under two minutes per workstation. Most support teams complete full rollout within a single shift. The lightweight desktop agent requires no integration with existing help desk software; it tracks application-level activity independently. Initial productivity baselines are available within the first full work week.
What tools does eMonitor track for support teams?
eMonitor tracks time spent in all major help desk platforms including Zendesk, Freshdesk, Intercom, HubSpot Service Hub, Salesforce Service Cloud, and LiveChat. It also monitors adjacent tools like Slack, Microsoft Teams, email clients, and internal knowledge bases, giving managers a complete view of agent time allocation.
How does monitoring prevent support agent burnout?
eMonitor's over-utilization alerts notify managers when agents exceed 85% utilization or work more than 8 consecutive hours without adequate breaks. Activity intensity tracking detects sustained high-stress patterns. Early intervention based on this data reduces burnout-related turnover, which costs $10,000 to $15,000 per support agent to replace (SHRM, 2025).
Start Monitoring Your Customer Support Team With Data, Not Guesswork
Customer support team monitoring bridges the gap between help desk metrics and actual agent behavior. The KPIs covered in this guide, from first response time and average handle time to agent utilization and context switching frequency, give support managers the data foundation for staffing decisions, coaching conversations, and SLA compliance. eMonitor provides the activity-level visibility that ticketing systems miss, starting at $4.50 per user per month with a 7-day free trial.
Get Your Support Team's Productivity Baseline in One Week
Install eMonitor, see real-time agent activity data, and identify your first optimization opportunity within days.
Sources
- MetricNet, "Help Desk Benchmarking Report," 2025
- Forrester Research, "The Cost of Customer Service Interactions," 2024
- Zendesk, "CX Trends Report," 2025
- Gartner, "Contact Center Workforce Management Best Practices," 2025
- Harvard Business Review, "Contact Center Attrition and Utilization Thresholds," 2024
- SHRM, "Employee Turnover Cost Benchmarks by Role," 2025
- ICMI, "Contact Center Coaching and Performance Research," 2025
- Mark, Gonzalez, Harris, "No Task Left Behind? Examining the Nature of Fragmented Work," University of California, Irvine, 2005
- Electronic Communications Privacy Act, 18 U.S.C. 2511