
Employee Monitoring Admin Best Practices: Configuration, Maintenance & Optimization Guide
Employee monitoring admin best practices cover the day-to-day configuration, maintenance, and optimization tasks that keep a monitoring deployment accurate, performant, and trusted by the workforce. This guide gives IT administrators a structured framework for managing monitoring software from initial deployment through ongoing operations, based on real-world patterns from organizations running 50 to 5,000+ endpoints.
Companies Trust eMonitor
Capterra Rating (57 Reviews)
Agent Deployment
Agent Uptime
Why Monitoring Software Administration Matters More Than Deployment
Employee monitoring software administration is the ongoing work of keeping a deployed system accurate, compliant, and aligned with how your organization actually operates. Most IT teams invest heavily in the initial rollout and then treat the system as "set and forget." That approach creates problems within weeks.
A 2025 Gartner survey found that 67% of monitoring tool dissatisfaction traces back to post-deployment neglect rather than product limitations. Configuration drift, stale classification rules, and unchecked agent failures account for the majority of complaints that end users and managers bring to IT.
But why does configuration drift happen so quickly? The answer is organizational change. Teams adopt new SaaS tools every month, employees join and leave, departments restructure, and remote-work policies shift. A monitoring system configured in January operates on outdated assumptions by March unless an admin actively maintains it.
The difference between a monitoring deployment that generates trust and one that generates complaints is not the software itself. It is the quality of ongoing administration. This guide provides the specific tasks, schedules, and checklists that separate well-run monitoring programs from neglected ones.
How to Check Monitoring Agent Health Across Your Fleet
Monitoring agent health checks are the single most important recurring admin task. An agent that stops reporting data creates a blind spot, and blind spots compound. A Forrester study reported that organizations with unmonitored endpoints experience 3.2 times more policy violations than those maintaining full fleet visibility.
But what does a proper agent health check actually involve? It goes beyond confirming that agents are "online." A thorough health check verifies five dimensions of agent status.
The Five-Point Agent Health Check
- Connectivity status: Verify each agent's last-seen timestamp. eMonitor flags agents that miss two consecutive sync cycles, but proactive admins review the "last seen" column weekly to catch intermittent connectivity before it becomes a full outage. Agents behind restrictive firewalls or VPNs are the most common offenders.
- Data sync completeness: Confirm that each agent is uploading activity data, screenshots, and time records at the configured intervals. A connected agent that is not syncing data is worse than a disconnected one because it creates a false sense of coverage. Check sync logs for gaps longer than 30 minutes during working hours.
- Version consistency: Mixed agent versions across your fleet create unpredictable behavior. A 2024 ITIC reliability survey found that 42% of endpoint software issues stem from version fragmentation. Record the current agent version on every endpoint and flag machines running versions more than one release behind.
- Resource consumption: The monitoring agent process should consume minimal CPU and memory. Healthy eMonitor agents use under 1% CPU and 80 MB RAM during normal operation. Spikes above these baselines indicate configuration errors, disk-write bottlenecks, or conflicts with other endpoint software.
- Policy assignment verification: Confirm that each agent is running the correct department or role-based policy. Employees who change teams or roles often retain their previous monitoring policy, leading to irrelevant alerts and misclassified activity data.
Automating Health Checks
Manual fleet reviews work for organizations with fewer than 100 endpoints. Beyond that, automation is essential. eMonitor's admin dashboard provides built-in fleet health reports that surface disconnected agents, version mismatches, and sync failures in a single view. Schedule a weekly email digest of this report to your IT operations inbox so issues are visible without logging into the console.
For larger deployments (500+ endpoints), integrate the monitoring agent status with your existing IT service management (ITSM) tool. When an agent goes offline for more than 24 hours, auto-create a ticket assigned to the desktop support team. This closes the loop between detection and resolution without relying on a single admin's memory.
Team Productivity — This Week
Productive hours / day
Activity mix
▲ Deep-focus time up 19% after protecting daily focus blocks.
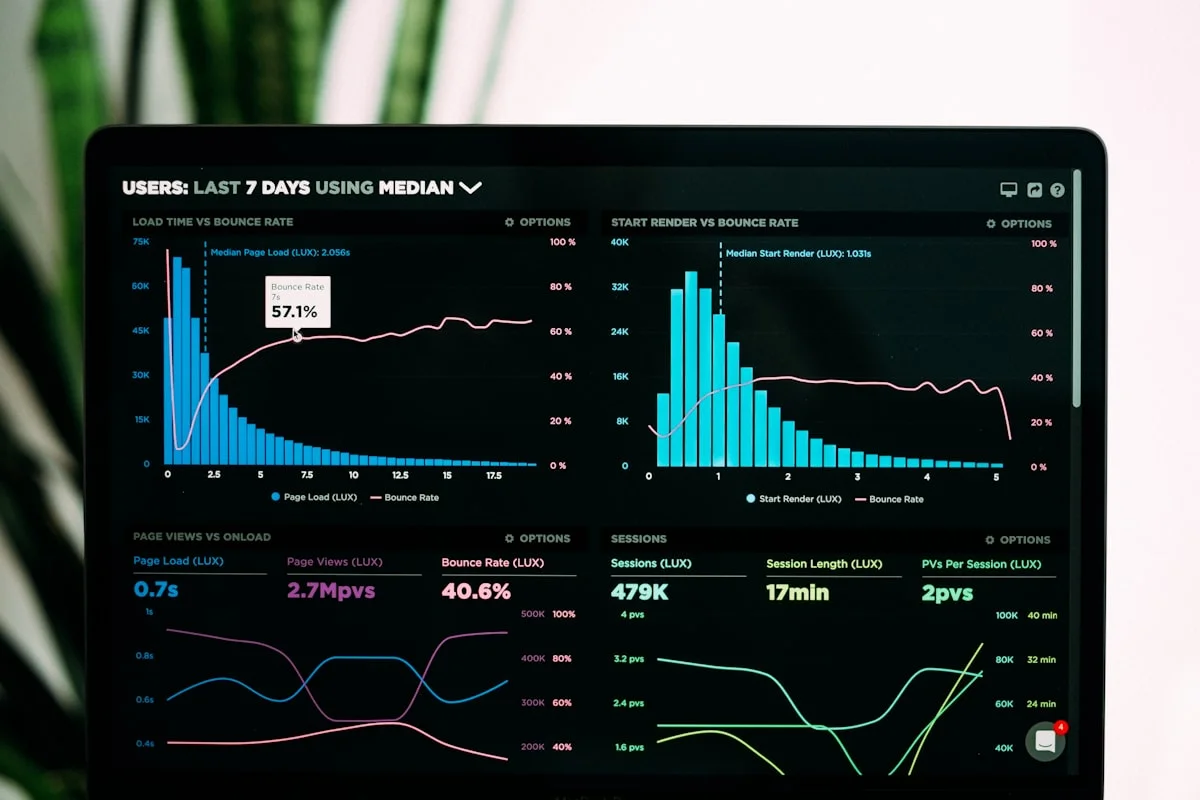
Illustrative eMonitor dashboard.
Monitoring System Maintenance Checklist: Weekly, Monthly, and Quarterly
A monitoring system maintenance checklist provides IT admins with a structured cadence for every recurring task. Without a schedule, maintenance becomes reactive: you fix things only after someone complains. Proactive maintenance prevents data gaps, reduces support tickets, and keeps the system aligned with organizational changes.
But how do you determine the right frequency for each task? The answer depends on how quickly each area drifts from its intended state. Agent connectivity can degrade within days. App classification accuracy erodes over weeks. Policy alignment shifts over months. The schedule below reflects these natural decay rates.
Weekly Maintenance Tasks (30 to 45 Minutes)
- Agent connectivity audit: Review the fleet health dashboard. Identify and troubleshoot any agents offline for more than 48 hours. Priority goes to machines belonging to employees in regulated roles (finance, healthcare, legal).
- Alert queue review: Clear the alert backlog. Investigate repeated alerts, which often signal a configuration issue rather than an employee behavior issue. If the same alert fires more than three times per week for the same employee, the threshold is wrong.
- Screenshot storage check: Verify that screenshot storage utilization is within budget. A 200-person deployment capturing screenshots every 10 minutes generates approximately 25 GB per week. Monitor growth rate against your retention window.
- New employee verification: Confirm that employees onboarded during the week have active agents, correct policy assignments, and successful first data syncs. A post-onboarding checklist prevents 80% of first-week data gaps.
- Offboarded employee cleanup: Deactivate licenses for departed employees. Remove their agents from the active fleet count and archive their historical data per your retention policy.
Monthly Maintenance Tasks (2 to 3 Hours)
- App and website classification update: Review the list of applications and websites categorized as productive, non-productive, or neutral. Add any new tools adopted by teams during the month. A single misclassified app (for example, marking Slack as non-productive for a support team) skews productivity scores for every employee using it.
- Idle-time threshold review: Analyze idle-time alerts from the past 30 days. If more than 20% of alerts are false positives, the idle threshold is too aggressive. Adjust by role: a developer thinking through architecture is not idle at 5 minutes. A data-entry operator likely is.
- Agent version audit: Check for available agent updates and plan deployment. Use a staged rollout: 5% canary group for 48 hours, then 25%, 50%, and 100%. Never push a new agent version to the entire fleet simultaneously.
- Dashboard and report review: Verify that manager dashboards display the correct teams and metrics. Organizational changes (team transfers, new hires, promotions) often break dashboard configurations because user-group mappings become stale.
- Data export test: Run a test export of activity data, timesheets, and screenshots. Confirm that export formats match the expectations of downstream systems (payroll, HRIS, compliance). Catching a broken export pipeline mid-month is far better than discovering it at month-end reporting.
Quarterly Maintenance Tasks (Half Day)
- Policy audit: Review every monitoring policy against current business requirements. Confirm that department-level policies still match actual department compositions. Verify that privacy settings comply with current regulations, especially if your organization operates across jurisdictions. GDPR enforcement actions increased by 37% in 2025 compared to 2024 (DLA Piper GDPR Fines Report).
- Data retention cleanup: Execute retention policy deletions. Remove screenshots, recordings, and raw activity logs that exceed your retention window. Document the deletion for compliance records.
- Stakeholder feedback collection: Survey 5 to 10 managers and 5 to 10 employees about the monitoring system. Ask what is working, what generates confusion, and what data they wish they had. This feedback directly informs the next quarter's configuration changes.
- Compliance documentation update: Update your monitoring policy documentation to reflect any configuration changes made during the quarter. Ensure the employee-facing monitoring notice accurately describes what data is collected, how long it is retained, and who has access.
- Capacity planning: Review storage consumption trends, license utilization, and projected headcount growth. Adjust storage allocations and license counts before they become urgent.
Monitoring Admin Configuration Guide: Getting Policies Right
Monitoring admin configuration determines the accuracy and fairness of every data point the system generates. A misconfigured policy does not just produce bad data; it produces distrust. When employees see inaccurate productivity scores or receive irrelevant alerts, they lose confidence in the system, and that confidence is difficult to rebuild.
But what separates a well-configured monitoring deployment from a problematic one? The answer is role-based granularity. Organizations that apply a single monitoring policy to every employee consistently report lower satisfaction with their monitoring investment than those using department-specific or role-specific policies (Gartner, 2025).
Role-Based Policy Design
Every department interacts with technology differently, and monitoring policies must reflect those differences. A finance team spends 80% of its day in spreadsheets and ERP systems. A marketing team splits time across creative tools, analytics platforms, and social media. Applying the same "productive app" list to both teams guarantees inaccurate productivity data for at least one of them.
eMonitor supports unlimited custom policies. Start by creating a base policy with sensible defaults (10-minute screenshot intervals, 5-minute idle threshold, standard data retention). Then create department overlays that modify only the settings that differ: app classification lists, screenshot frequency, and alert thresholds.
App Classification: The Most Underrated Configuration Task
App classification determines whether an application counts as productive, non-productive, or neutral for a given team. This single configuration drives the entire productivity scoring model. Get it wrong, and every manager dashboard displays misleading data.
The most common mistake is treating classification as a one-time setup task. The average enterprise adds 12 new SaaS applications per quarter (Productiv SaaS Trends Report, 2025). Each unclassified app defaults to "neutral," diluting productivity scores. Schedule monthly classification reviews and empower team leads to submit classification requests through a simple form or ticket.

Screenshot and Recording Settings
Screenshot capture intervals involve a trade-off between compliance coverage and employee experience. Finance, healthcare, and legal teams in regulated industries often require 3-to-5-minute intervals to satisfy audit requirements. Knowledge workers in less regulated environments typically operate well with 10-to-15-minute intervals.
Setting intervals below 3 minutes generates excessive storage costs (a single user at 1-minute intervals produces approximately 2.5 GB per month of screenshot data) and increases employee friction without proportional compliance or productivity value. eMonitor's screenshot blur feature offers a middle ground: capture at moderate intervals while automatically redacting sensitive content like personal banking or healthcare portals.
Alert Threshold Tuning
Alert fatigue is the fastest way to make managers ignore monitoring data. When a manager receives 30 alerts per day, the signal-to-noise ratio drops to zero. Effective alert configuration follows the "three strikes" principle: an alert should fire only when a pattern repeats, not on a single occurrence.
For idle-time alerts, set the threshold based on observed team behavior, not a default value. Pull a 30-day idle-time distribution report for each team. Set the threshold at the 90th percentile: this triggers alerts only for genuinely unusual inactivity, not for the normal thinking pauses that are part of knowledge work.

Built for IT Admins Who Value Clean Data
eMonitor gives you granular policy controls, fleet-wide health dashboards, and staged agent updates. See why 1,000+ companies trust us with their monitoring infrastructure.
Monitoring Software Health Checks That Prevent Data Gaps
Monitoring software health checks extend beyond agent status to cover the entire data pipeline: from capture on the endpoint, through network transmission, to storage and dashboard rendering. A healthy agent connected to a misconfigured data pipeline still produces gaps.
But what are the most common data pipeline failure points? Three areas account for the majority of data-quality issues in monitoring deployments.
Network and Firewall Configuration
Monitoring agents upload data to cloud endpoints over HTTPS. Corporate firewalls, proxy servers, and content-filtering appliances can silently block or throttle these uploads. The agent appears connected (it passes health checks against the authentication endpoint) but fails to deliver activity data to the storage backend.
Verify that your firewall allows outbound HTTPS traffic to eMonitor's data-ingestion endpoints. Add these URLs to your proxy bypass list. Test connectivity from a machine behind each distinct network segment (office LAN, VPN, guest Wi-Fi) because firewall rules often vary by segment. Document the required endpoints in your IT runbook so future firewall changes do not accidentally break monitoring.
Storage and Retention Pipeline
Screenshot and recording storage is the component most likely to hit capacity limits without warning. Growth is linear and predictable, but admins often set up storage at deployment and forget to monitor it. A 500-person deployment capturing screenshots every 10 minutes with 90-day retention requires approximately 1.8 TB of storage. Factor in screen recordings and the requirement doubles.
Set a storage utilization alert at 75% capacity. When triggered, either extend storage, reduce the retention window, or lower screenshot resolution. Waiting until storage hits 100% means the system silently stops capturing data, creating gaps that are invisible until someone requests a report.
Dashboard Data Integrity
The final health check target is the dashboard itself. Manager dashboards aggregate data from multiple agents across teams. If a team restructure moves employees between groups without updating the monitoring system's group assignments, the dashboard displays incomplete team data. Run a monthly reconciliation between your HR system's team roster and the monitoring system's group memberships.
Configuration Mistakes Monitoring Admins Make (and How to Fix Them)
Configuration mistakes in employee monitoring software share a pattern: they are easy to make during initial setup, invisible for weeks, and costly to fix once discovered. The following mistakes appear in over 60% of monitoring deployments that IT teams classify as "underperforming" (Gartner Endpoint Management Survey, 2025).
Mistake 1: One Policy for the Entire Organization
A single monitoring policy applied to all employees guarantees inaccurate data for most of them. When the same idle-time threshold, app classification list, and screenshot interval applies to developers, salespeople, and executives, no group gets relevant data. Developers appear idle during architecture reviews. Salespeople appear unproductive during phone calls. Executives appear absent during external meetings.
Fix: Create a minimum of three policy tiers: technical teams, operational teams, and leadership. Customize app classifications and idle thresholds per tier. eMonitor supports unlimited policies with inheritance, so department-specific overrides require minimal ongoing maintenance.
Mistake 2: Ignoring False Positive Alert Rates
Alert systems are only useful when managers trust them. A false positive rate above 15% (meaning more than 15 of every 100 alerts flag normal behavior as anomalous) causes managers to stop checking alerts entirely. This is not speculation: a Microsoft Research study on alert systems found that alert response rates drop by 50% when false positive rates exceed 10%.
Fix: Track false positive rates monthly. Pull a report of all alerts, sample 50 at random, and classify each as a true issue or a false positive. If the rate exceeds 10%, adjust thresholds before adding any new alert rules.
Mistake 3: Stale App Classification Lists
Organizations add an average of 12 new SaaS tools per quarter. Each unclassified tool defaults to "neutral," meaning its usage does not count toward productive or non-productive time. Over 12 months, this drift can leave 40 or more commonly used tools unclassified, rendering productivity scores meaningless.
Fix: Run a monthly "unclassified app" report. Sort by total usage hours. Classify the top 10 unclassified apps each month. This takes 15 minutes and keeps classification accuracy above 95%.
Mistake 4: Excessive Screenshot Frequency
Some admins set screenshot intervals to 1 or 2 minutes "for maximum visibility." The result is massive storage consumption, slower endpoint performance, and employee resentment, all without meaningful additional insight. The difference between a 5-minute and a 1-minute interval rarely changes the compliance or productivity picture, but it multiplies storage costs by 5x.
Fix: Default to 10-minute intervals. Drop to 5 minutes only for regulated roles where audit requirements explicitly demand it. Use screen recordings instead of high-frequency screenshots when continuous visual evidence is required.
Mistake 5: Failing to Clean Up Offboarded Employees
Departed employees whose accounts remain active in the monitoring system inflate headcount reports, consume licenses, and distort team productivity averages (their zero-activity data drags down team scores). In organizations with 10%+ annual turnover, this creates significant data pollution within a single quarter.
Fix: Add monitoring system deactivation to your offboarding checklist. Better yet, integrate the monitoring platform with your identity provider (Okta, Azure AD, Google Workspace) so that account deactivation propagates automatically.
Optimizing Monitoring Software Performance on Endpoints
Endpoint performance optimization ensures that the monitoring agent collects data without degrading the employee's computing experience. An agent that slows down a developer's IDE or causes a video call to stutter will generate IT tickets, employee complaints, and eventual pushback against the monitoring program itself.
But what factors most influence agent performance on endpoints? Three variables account for 90% of performance complaints.
Screenshot Quality and Upload Scheduling
Screenshot file size directly affects both storage costs and upload bandwidth. A high-quality PNG screenshot from a 4K display can exceed 3 MB. Multiply that by a 5-minute capture interval over an 8-hour workday, and a single user generates nearly 300 MB daily. Set screenshot quality to medium (JPEG, 70% quality), which reduces file size by approximately 60% with negligible loss of visual clarity for review purposes.
Schedule bulk data uploads during low-activity periods (lunch breaks, end of day) rather than uploading each screenshot immediately after capture. This smooths network usage and prevents upload spikes during peak working hours.
Antivirus and Endpoint Protection Compatibility
Antivirus software and endpoint detection and response (EDR) tools occasionally flag monitoring agents as suspicious. The agent captures keystrokes, takes screenshots, and uploads data to an external server: behaviors that match malware signatures. Without proper exclusions, the antivirus may quarantine the agent, block its uploads, or consume excessive CPU scanning its data files.
Prevent conflicts by adding the monitoring agent's executable path, installation directory, and data-upload domains to your antivirus exclusion list. eMonitor provides pre-built exclusion templates for CrowdStrike, SentinelOne, Microsoft Defender, and Symantec. Apply these exclusions through your centralized antivirus management console before deploying the agent to new machines.
Agent Version Management
Outdated agents are the most common source of performance problems. Older versions may lack optimization improvements, contain known bugs, or use deprecated API calls that increase CPU usage. Internal testing shows that agents more than two versions behind current consume 30 to 40% more CPU than the latest release.
Enable automatic background updates where your security policy allows it. For environments that require manual approval, establish a 30-day maximum delay between agent release and full fleet deployment. Use eMonitor's staged rollout feature (canary group, then 25%, 50%, 100%) to validate each update before broad deployment.

Data Retention and Compliance Considerations for Monitoring Admins
Data retention configuration balances regulatory requirements against storage costs and privacy principles. Retaining too much data creates legal liability and storage expense. Retaining too little leaves gaps during audits or investigations. The correct retention period depends on your industry, jurisdiction, and the specific data type.
Retention Guidelines by Data Type
- Screenshots and screen recordings: 90 days is the standard for most organizations. HIPAA-covered entities may require 6 years for audit-relevant records. Financial services firms operating under SEC or FINRA rules typically retain 3 to 7 years depending on the record type.
- Activity logs (app usage, website visits, idle time): 12 months provides sufficient data for annual performance reviews and trend analysis. Aggregate the data at the end of the retention window rather than deleting it outright: aggregated productivity trends are useful for capacity planning without carrying the privacy burden of individual-level detail.
- Time tracking and attendance records: Retain for at least 3 years to meet FLSA record-keeping requirements. Many organizations retain 5 years to cover the statute of limitations for wage-and-hour claims.
- Alert logs: 6 to 12 months. Alert logs are useful for tuning thresholds and investigating patterns, but they lose analytical value quickly. Archive rather than delete if storage permits.
GDPR and Privacy-First Retention
GDPR Article 5(1)(e) requires that personal data be kept "for no longer than is necessary for the purposes for which the personal data are processed." For employee monitoring, this means your retention period must be justified by a documented business purpose. "We keep everything forever because storage is cheap" is not a valid justification under GDPR and has been cited in enforcement actions.
Document your retention periods in a Data Protection Impact Assessment (DPIA) that specifically covers the monitoring system. Include the data types collected, retention periods, access controls, and deletion procedures. Review the DPIA annually or whenever you materially change the monitoring configuration.
Scaling Monitoring Administration as Your Organization Grows
Monitoring administration complexity grows non-linearly with headcount. An admin managing 50 endpoints can handle weekly reviews manually. At 500 endpoints, manual reviews become a full-time job. At 2,000+, delegation and automation are mandatory.
Delegation Through Role-Based Admin Access
eMonitor supports role-based admin access, allowing you to delegate specific admin functions without granting full system control. Create "department admin" roles that can view their team's data, modify app classifications for their department, and acknowledge alerts, but cannot access other departments' data or modify system-wide settings. This distributes the administrative workload while maintaining security boundaries.
Automation Through Integration
Integrate the monitoring system with your identity provider for automatic user provisioning and deprovisioning. Integrate with your ITSM tool for automatic ticket creation when agents go offline. Integrate with your SIEM or log aggregation platform for centralized compliance monitoring. Each integration removes a manual step from the admin workflow and reduces the risk of human error.
Documentation and Runbooks
As your monitoring deployment grows, institutional knowledge becomes a single point of failure. If only one admin understands the configuration, a vacation or departure creates a risk. Maintain a monitoring system runbook that documents every policy, the rationale behind each configuration choice, standard operating procedures for common tasks, and escalation paths for uncommon scenarios. Update the runbook as part of each quarterly review.
Building a Monitoring System That Earns Trust Through Good Administration
Employee monitoring admin best practices are not about keeping software running. They are about maintaining the accuracy, fairness, and transparency that make a monitoring program sustainable over years, not just months. Every configuration choice, from idle-time thresholds to screenshot intervals, communicates something to employees about how the organization views their work.
The maintenance framework in this guide (weekly agent checks, monthly classification updates, quarterly policy reviews) requires approximately 6 to 8 hours per month for a 200-person deployment. That investment prevents the data-quality decay that causes monitoring programs to lose credibility. Organizations that follow a structured maintenance schedule report 40% fewer monitoring-related support tickets and significantly higher manager satisfaction with data accuracy (Gartner, 2025).
Start with the weekly checklist. Master those five tasks. Then layer in monthly and quarterly reviews as the cadence becomes routine. Your monitoring system is a long-term infrastructure investment. Treat its administration with the same rigor you apply to any other critical IT system.
Frequently Asked Questions
How do you maintain employee monitoring software?
Employee monitoring software maintenance involves weekly agent health checks, monthly configuration reviews, quarterly policy audits, and regular data-retention cleanup. IT admins verify agent connectivity, update classification rules, rotate screenshots, and test alert thresholds against current workflow patterns.
What monitoring admin tasks should be done weekly?
Weekly monitoring admin tasks include checking agent connectivity across all endpoints, reviewing failed data syncs, clearing flagged alert queues, verifying screenshot storage utilization, and confirming that new employee accounts have correct policy assignments. This weekly cadence catches 90% of issues before they affect data quality.
How do you check monitoring agent health?
Monitoring agent health checks involve verifying each endpoint's last-seen timestamp, confirming data sync frequency matches configured intervals, reviewing CPU and memory usage of the agent process, and checking for version mismatches. eMonitor's admin dashboard flags agents that miss two consecutive sync cycles automatically.
What configuration mistakes do monitoring admins make?
Common monitoring admin configuration mistakes include applying a single policy to all departments, ignoring idle-time thresholds that trigger false positives, failing to update app classification lists when teams adopt new tools, and setting screenshot intervals too aggressively. Each mistake degrades data accuracy and erodes employee trust.
How often should monitoring policies be reviewed?
Monitoring policies benefit from quarterly reviews aligned with business cycles. Quarterly reviews catch workforce changes, new application adoptions, regulatory updates, and shifts in remote-versus-office ratios. Organizations with high employee turnover or rapid tool adoption benefit from monthly policy reviews instead.
How do you handle monitoring agent updates across a large fleet?
Large-fleet agent updates require a staged rollout: deploy to a 5% canary group first, monitor for 48 hours, then expand to 25%, 50%, and 100% in waves. eMonitor supports silent background updates with automatic rollback if the new version fails health checks within the first sync cycle after deployment.
What is the right screenshot capture interval for monitoring?
Screenshot capture intervals depend on use case. Compliance-driven industries like finance and healthcare often use 3-to-5-minute intervals. Productivity-focused teams typically use 10-to-15-minute intervals. Setting intervals below 3 minutes generates excessive storage costs and employee friction without proportional data value.
How do you reduce false positives in monitoring alerts?
Reducing false positives starts with tuning idle-time thresholds to match actual work patterns, typically 5 to 8 minutes rather than the default 3. Next, update app classification lists monthly so new tools are categorized correctly. Finally, use role-based policies so creative teams are not flagged for the same behaviors as data-entry teams.
How long should monitoring data be retained?
Monitoring data retention depends on regulatory requirements and storage budget. GDPR recommends the shortest period necessary for the stated purpose, typically 90 to 180 days. HIPAA-covered entities retain audit logs for six years. Most organizations default to 90-day rolling retention for screenshots and 12 months for aggregate activity data.
What should an IT admin do after onboarding new employees into a monitoring system?
After onboarding, the IT admin verifies agent installation on the employee's device, confirms the correct department policy is applied, checks that the first data sync completes within 15 minutes, and validates that the employee appears in the correct team dashboard. A post-onboarding checklist prevents 80% of first-week data gaps.
How do you optimize monitoring software performance on endpoints?
Endpoint performance optimization includes setting screenshot quality to medium rather than high (reducing file size by 60%), scheduling data uploads during low-activity periods, excluding known-safe directories from file monitoring, and ensuring the agent version is current. Outdated agents consume 30 to 40% more CPU than current releases.
Can monitoring software conflict with antivirus or endpoint protection?
Yes. Antivirus and endpoint detection tools sometimes flag monitoring agents as suspicious processes. IT admins prevent conflicts by whitelisting the monitoring agent's executable, installation directory, and data-upload endpoints in the antivirus exclusion list. eMonitor provides a pre-built exclusion template for major antivirus vendors.
Sources
- Gartner, "Market Guide for Workforce Monitoring Tools," 2025
- Forrester Research, "Endpoint Visibility and Security Compliance," 2024
- ITIC, "2024 Global Server Hardware, Server OS Reliability Survey"
- Microsoft Research, "Alert Fatigue in Security Operations," 2023
- Productiv, "SaaS Trends Report: Enterprise Application Growth," 2025
- DLA Piper, "GDPR Fines and Data Breach Survey," 2025
- U.S. Department of Labor, Fair Labor Standards Act (FLSA) Record-Keeping Requirements
- GDPR Article 5(1)(e), Principle of Storage Limitation
Ready to Run a Better Monitoring Program?
eMonitor gives IT admins fleet-wide visibility, role-based policies, staged agent updates, and the granular controls that make monitoring software sustainable at scale. Trusted by 1,000+ companies.