
Employee Monitoring False Positives: How to Avoid Wrong Conclusions From Productivity Data
Employee monitoring false positives are incorrect alerts or misleading data points that flag normal employee behavior as problematic. These wrong conclusions from productivity data lead to unfair confrontations, damaged trust, and poor management decisions. A 2023 Gartner survey found that 47% of managers using monitoring tools made at least one incorrect performance judgment per quarter based on misinterpreted data. This guide explains why monitoring data misinterpretation happens, identifies the most common false alert patterns, and provides a practical framework for tuning your monitoring system to minimize errors and protect your team's trust.
What Are Employee Monitoring False Positives?
An employee monitoring false positive occurs when the monitoring system flags normal, legitimate work behavior as problematic. The software registers an anomaly, sends an alert, or marks a metric in red, but the employee was actually working productively. The alert is technically "correct" in detecting a deviation from expected patterns, but the conclusion drawn from it is wrong.
Consider a simple example. A software developer spends 45 minutes reading a complex technical specification in a PDF viewer. The monitoring system records zero keyboard activity and minimal mouse movement during that period. The idle time detection flags this as "unproductive time," and the manager's weekly report shows the developer with 45 minutes of unexplained inactivity. That is a false positive: the system detected a real pattern (no input activity) but misinterpreted its meaning (the developer was deeply focused on critical work).
How common are employee monitoring false positives in practice? Research from the Harvard Business Review (2023) found that organizations using default monitoring configurations, without role-specific tuning, experienced false positive rates between 20% and 35% on their automated alerts during the first six months of deployment. That means roughly one in three to one in five alerts was wrong.
The consequences of unaddressed false positives extend far beyond wasted manager time. When employees receive unfair reprimands based on flawed data, trust erodes rapidly. A Society for Human Resource Management (SHRM) study in 2024 reported that 62% of employees who experienced a wrongful accusation based on monitoring data began actively job-searching within 90 days. False positives do not just waste time; they cost the organization its best people.
Why Monitoring Data Produces Wrong Conclusions
Employee monitoring data becomes misleading when quantitative metrics are treated as qualitative judgments. A dashboard showing "3 hours of non-productive app usage" is a data point. Concluding that the employee wasted 3 hours is an interpretation, and often a wrong one. The gap between data and truth has several root causes.
The Context Gap
Monitoring software captures what happened on a screen. It does not capture why. An employee browsing LinkedIn for 20 minutes could be procrastinating, or they could be a recruiter sourcing candidates, a marketer researching competitor announcements, or a sales rep warming up a prospect. The same activity carries completely different productivity meanings depending on the person's role and current task.
This context gap is the single largest source of employee monitoring false positives. A study by Cornell University's Institute for Compensation Studies (2022) found that 73% of monitoring misinterpretations traced back to systems that did not account for role-specific work patterns. The monitoring tool measured accurately; the interpretation was wrong because it lacked context.

The Input Bias
Most monitoring systems measure input activity: keyboard strokes, mouse clicks, application switches, and screen changes. This creates a systematic bias toward roles that produce high input volume (data entry, customer service chat, coding) and against roles that involve thinking, reading, planning, and verbal communication. A project manager who spends two hours on a phone call with a client generates zero input activity. A strategic planner reviewing quarterly data in their head before writing a single word of the annual plan appears "idle" for extended periods.
Input bias affects monitoring data accuracy most severely in knowledge-work environments. The American Psychological Association's 2023 workplace study noted that knowledge workers spend an average of 28% of their workday on activities that produce no measurable digital input: phone calls, in-person meetings, reading printed materials, brainstorming on whiteboards, and focused thinking. Monitoring systems that rely primarily on input metrics misrepresent nearly a third of the knowledge worker's day.
The Baseline Fallacy
Many monitoring tools compare individual employee behavior against a team or company average. If the average employee uses their design tool for 5 hours per day and one employee uses it for only 2.5 hours, the system flags the deviation. But averages hide enormous natural variation. The employee using the tool less might be a senior designer who spends more time in client meetings and design reviews. They might work faster. They might use a different tool for the same output.
Comparing individuals against group averages without accounting for role seniority, project phase, and workflow variation produces a constant stream of false alerts. This baseline fallacy is especially damaging because it systematically flags the most unusual, often the most creative and senior, employees.
The Snapshot Problem
Monitoring data captures snapshots, not stories. A single screenshot showing an employee on a news website at 2:15 PM on a Tuesday is a snapshot. It tells you nothing about the 7 hours of focused work that preceded it, the fact that the employee just finished a major deliverable, or that a 10-minute mental break after deep work actually improves subsequent performance. Research from the University of Illinois (Ariga and Lleras, 2011) demonstrated that brief mental breaks during sustained tasks improve focus by 15-20% compared to continuous work without breaks. Punishing the behavior that monitoring data shows as a "deviation" would actually reduce the employee's overall productivity.
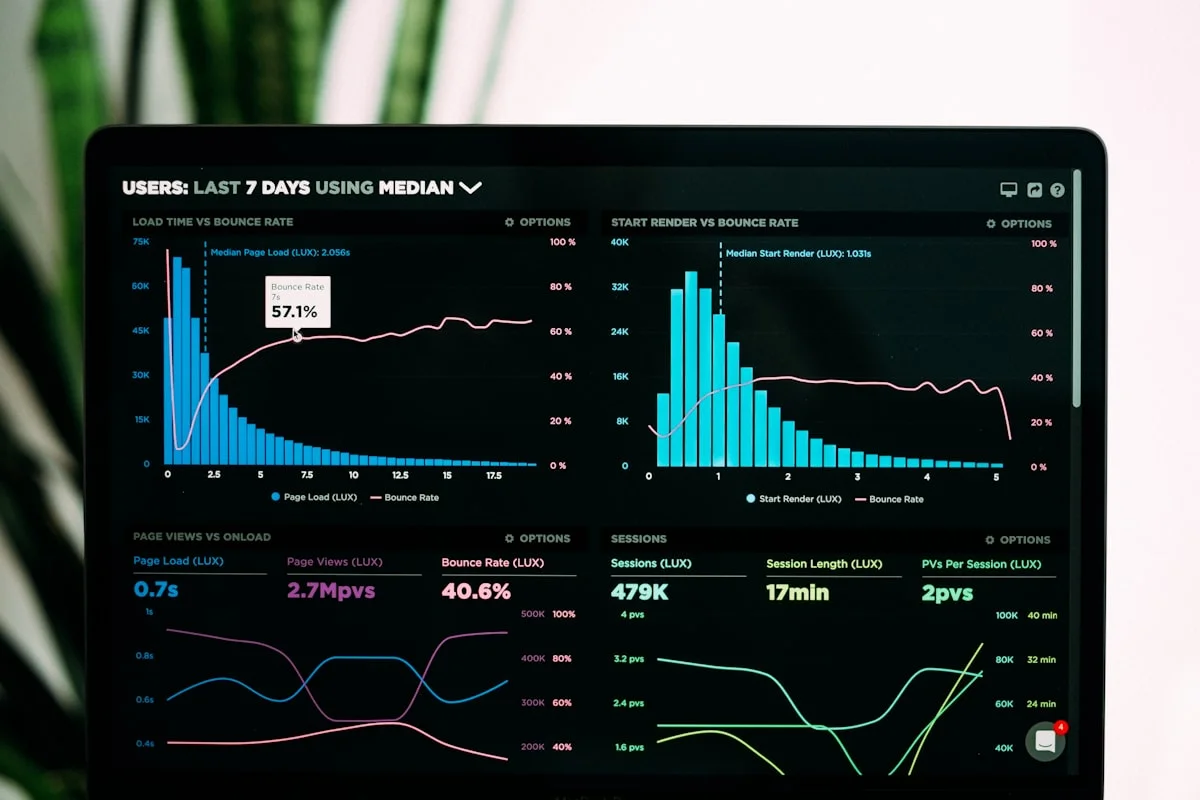
Team Productivity — This Week
Productive hours / day
Activity mix
▲ Deep-focus time up 19% after protecting daily focus blocks.
Illustrative eMonitor dashboard.
7 Common Employee Monitoring False Positives and How to Recognize Them
Recognizing false positive patterns is the first step toward eliminating wrong conclusions from productivity data. Here are the seven most frequent patterns we see organizations encounter.
1. The Phone Call Ghost
An employee takes a 30-minute client call from their desk phone or mobile. During the call, their computer shows zero activity. The monitoring system logs 30 minutes of idle time. In reality, the employee was conducting essential business, potentially generating revenue or resolving a critical client issue. This false positive disproportionately affects sales teams, account managers, support staff, and senior leaders who spend significant time on calls.
Recognition signal: Idle time blocks that coincide with calendar meeting entries or correlate with high output periods.
2. The Research Rabbit Hole
A marketing analyst spends 45 minutes reading industry reports, competitor websites, and market data across 15 different browser tabs. The monitoring system classifies 60% of these websites as "non-productive" because they are not on the company's approved productive-site list. The analyst was doing exactly the research their job requires, but the rigid classification system flagged it as unproductive browsing.
Recognition signal: "Unproductive browsing" alerts concentrated among roles that require market research, competitive analysis, or industry expertise.
3. The Context-Switching Alarm
A project manager switches between Slack, email, a project management tool, a spreadsheet, and a video call within a 15-minute window. The monitoring system registers this rapid switching as "distraction" or "unfocused behavior." In reality, the project manager is doing their core job: coordinating across teams, unblocking issues, and keeping projects on track. High context-switching is not always a productivity problem. For some roles, it is the job itself.
Recognition signal: "High distraction" or "unfocused" flags concentrated among coordinators, project managers, and team leads.
4. The Offline Worker Blind Spot
An architect spends two hours sketching design concepts on paper before transferring them to CAD software. A lawyer reads a printed contract marked up with notes. A strategist fills a whiteboard with a framework during a brainstorming session. In each case, the monitoring system records two hours of minimal or zero computer activity. The employees were working at full capacity, but their work happened outside the digital environment the monitoring tool can see.
Recognition signal: Long idle periods followed by bursts of high digital activity (the transfer-to-digital phase).
5. The New Tool False Flag
The company adopts a new project management tool, but the monitoring system's application classification database has not been updated. The new tool is categorized as "uncategorized" or worse, "non-productive." Every minute employees spend learning and using the tool the company just mandated registers as wasted time. This false positive is common after software rollouts, tool migrations, and when employees adopt productivity tools that are not yet in the monitoring system's database.
Recognition signal: Sudden spikes in "uncategorized" or "non-productive" app usage across multiple employees simultaneously.
6. The Deep Work Misread
A data scientist runs a complex query and waits 8 minutes for results, reviewing the output mentally while the screen displays a loading indicator. A developer compiles code and reads error logs. A financial analyst waits for a large Excel model to recalculate. During these processing-wait periods, the employee generates minimal input activity. The monitoring system logs it as idle time, but the employee is actively engaged in work that requires machine processing time, a reality in technical roles.
Recognition signal: Short idle bursts (3-10 minutes) interspersed between periods of high activity in technical applications.
7. The Schedule-Shift Mismatch
An employee negotiated a flexible schedule: they work 7 AM to 3 PM instead of the standard 9 AM to 5 PM. The monitoring system, configured for the standard schedule, flags them as "leaving early" and shows them logging off two hours before the end of the "expected" workday. Their total hours are correct, but the system compares against the wrong schedule, generating a compliance alert that does not reflect reality.
Recognition signal: Schedule compliance alerts concentrated among employees with documented flexible or alternative schedules.
How to Tune Monitoring Alerts to Reduce False Positives
Reducing employee monitoring false positives is a configuration and process challenge, not a technology limitation. Modern monitoring platforms like eMonitor provide the tools to minimize false alerts. The question is whether organizations invest the time to configure them properly. Here is a systematic approach to tuning your monitoring alerts.

Step 1: Establish Role-Specific Baselines (Days 1-30)
Before configuring any alerts, run the monitoring system in observation mode for 30 days. During this period, collect data without triggering any alerts or taking any action. The goal is to establish what "normal" looks like for each role in your organization.
Key metrics to baseline by role:
- Average active input time per day (varies from 3 hours for a manager to 7 hours for a data entry specialist)
- Typical idle period duration and frequency (phone-heavy roles average 8-12 idle periods per day; heads-down coders average 2-3)
- Application mix (which apps are core to this role vs. which apps indicate off-task behavior)
- Schedule patterns (early starters, late workers, flexible schedules, compressed weeks)
- Output correlation (how does a "good output day" look in monitoring data vs. an "average" day?)
Step 2: Configure Role-Specific Classification Rules
The single most effective change for reducing monitoring data misinterpretation is moving from company-wide to role-specific application classification. YouTube is "non-productive" for an accountant but "productive" for a video editor, a social media manager, or a UX researcher studying competitor content. eMonitor supports per-team productivity classification rules, allowing each department to define what "productive" means for their specific workflows.
Classification configuration priorities:
- Create separate classification profiles for each major role category (engineering, design, sales, support, management, operations)
- Whitelist all applications mandated by the company, including newly adopted tools
- Set "neutral" as the default for uncategorized applications rather than "non-productive"
- Review and update classification rules quarterly or after any major tool change
Step 3: Set Graduated Alert Thresholds
Binary alerts ("idle for more than 10 minutes" = flag) produce the highest false positive rates. Graduated thresholds reduce false alerts by distinguishing routine deviations from genuine concerns. A practical three-tier structure:
- Informational (no action required): Idle periods of 10-20 minutes, non-productive app usage under 30 minutes/day. These appear in reports but do not trigger notifications.
- Review suggested (check context): Idle periods of 20-45 minutes, non-productive app usage of 30-90 minutes/day, significant deviation from 30-day baseline. These appear in the manager's weekly review queue.
- Action recommended (investigate): Idle periods exceeding 45 minutes with no calendar entry or approved reason, consistent multi-day deviations from baseline, non-productive usage exceeding 2 hours/day for 3+ consecutive days. These trigger a notification to the manager.
Organizations that implement graduated thresholds reduce their actionable false positive rate by 55-70% compared to binary alert systems, according to a 2024 analysis by Forrester Research.
Step 4: Implement Context Overlays
The most advanced technique for reducing wrong conclusions from monitoring data is overlaying activity data with contextual information. Calendar integrations allow the system to suppress idle-time alerts during scheduled meetings. Project management tool integrations help correlate research activity with assigned tasks. Communication platform data explains periods of low input activity during active Slack or Teams conversations.
eMonitor's activity timeline view places all data points on a single chronological view: app usage, idle periods, screenshots, and productivity classifications. This timeline format naturally provides the context that prevents misinterpretation, showing managers the story of an employee's day rather than isolated data points stripped of meaning.
Step 5: Monthly Alert Accuracy Reviews
Tuning monitoring alerts is not a one-time configuration task. It requires ongoing calibration. Conduct a monthly review of all alerts that led to manager action in the previous 30 days. For each alert, document:
- Was the alert accurate? (Did the flagged behavior actually represent a problem?)
- Did the manager's action produce a positive outcome?
- Could the alert threshold be adjusted to prevent similar false positives?
Track your false positive rate over time. The target after 90 days of tuning is a false positive rate below 10%. If your rate remains above 15%, your classification rules and thresholds need further adjustment.
A Framework for Reviewing Flagged Employee Monitoring Data
Even with well-tuned alerts, some flags will require human review. The quality of that review determines whether monitoring data leads to good decisions or wrong conclusions. Here is a five-question framework for evaluating any monitoring alert before taking action.
Question 1: What Is the Employee's Output?
Before examining monitoring data, check the employee's actual work output. Are deadlines being met? Is the quality of deliverables consistent? Are clients or internal stakeholders satisfied? If output is strong, the monitoring anomaly likely represents a workflow difference, not a performance problem. An employee who consistently delivers high-quality work on time but shows "unusual" monitoring patterns is almost certainly a false positive. Their workflow simply does not match the monitoring system's expectations.
Question 2: Does the Pattern Repeat or Is It Isolated?
A single day of unusual activity is rarely meaningful. People have off days. They have dental appointments, family emergencies, bad nights of sleep, and days when focus is harder than usual. Monitoring data becomes actionable only when it shows a sustained pattern, typically three or more occurrences over two or more weeks. Acting on a single data point is one of the fastest ways to generate a wrongful accusation based on monitoring data.
Question 3: Is There a Contextual Explanation?
Check the employee's calendar, project assignments, and recent communications. A day showing four hours of "idle time" the same day the employee was assigned to lead an in-person workshop has an obvious explanation. A week of reduced digital activity during the company's annual planning offsite is expected. Context answers most monitoring anomalies without requiring any conversation with the employee.
Question 4: Does the Data Align With Peer Feedback?
If monitoring data suggests an employee is underperforming, check whether that perception matches the experience of people who work with them directly. Team members, collaborators, and internal clients interact with the employee's actual contributions daily. If peers describe someone as responsive, reliable, and productive while the monitoring data says otherwise, the data is almost certainly wrong, or more precisely, the interpretation of the data is wrong.
Question 5: Would You Be Comfortable Explaining This Action to the Employee?
Before taking any action based on monitoring data, consider whether you could explain your reasoning to the employee in a transparent, fair conversation. If the basis for action is "the system flagged you for 45 minutes of idle time last Tuesday," most reasonable people would recognize that as insufficient. If the basis is "over the past three weeks, your output has declined by 30%, your deadlines have slipped, and the monitoring data shows a consistent shift in activity patterns that concerns me," you have a defensible, fair starting point for a supportive conversation.

Configure Monitoring That Reflects How Your Teams Actually Work
eMonitor supports role-specific productivity classifications, graduated alert thresholds, and contextual activity timelines so you see accurate data, not misleading numbers.
Legal and Compliance Risks of Acting on False Positives
Wrong conclusions from employee monitoring data carry real legal consequences. Organizations that discipline or terminate employees based on flawed data interpretations expose themselves to claims that are expensive, time-consuming, and reputationally damaging.
Wrongful Termination and Unfair Dismissal
In the United States, at-will employment does not protect employers who terminate based on demonstrably inaccurate evidence. If an employee can show that the monitoring data used to justify their termination was a false positive, and that the employer failed to investigate or provide context, the termination can be challenged. In the UK and EU, unfair dismissal claims have higher success rates when the employer relied on automated system outputs without adequate human review. The UK Employment Appeal Tribunal has ruled in multiple cases that disciplinary action based solely on automated monitoring data, without contextual investigation, constitutes procedural unfairness.
GDPR Article 22: Automated Decision-Making
Under the EU General Data Protection Regulation, Article 22 gives individuals the right not to be subject to decisions based solely on automated processing that produce legal or similarly significant effects. If an organization uses monitoring software alerts to make promotion, disciplinary, or termination decisions without meaningful human review, it violates Article 22. The penalty for GDPR violations reaches up to 4% of annual global turnover or 20 million euros, whichever is higher.
Discrimination Through Algorithmic Bias
Monitoring false positives do not affect all employees equally. Employees with disabilities that affect typing speed generate more idle-time flags. Employees who use assistive technology may trigger "unusual activity" alerts. Employees whose cultural communication style involves more phone calls and fewer emails appear less "active" in digital monitoring. If a pattern of false positives disproportionately affects a protected group and leads to adverse employment actions, the organization faces discrimination liability. The U.S. Equal Employment Opportunity Commission (EEOC) issued guidance in 2023 specifically addressing algorithmic bias in employment decisions, including monitoring-based decisions.
Documentation and Due Process
The strongest legal protection against false-positive liability is a documented review process. Organizations that maintain records showing they investigated alerts, considered context, spoke with employees, and corroborated data before taking action are far better positioned to defend their decisions. A written policy that prohibits employment actions based solely on monitoring data, requiring at least two additional data sources (output quality, peer feedback, manager observation), creates a defensible decision framework.
How eMonitor Helps Prevent False Positives and Wrong Conclusions
eMonitor's approach to monitoring data accuracy is built around a core principle: data should inform conversations, not replace them. The platform provides several specific features designed to reduce false positives and help managers draw correct conclusions from productivity data.
Role-Specific Productivity Classification
eMonitor allows administrators to create separate productivity classification profiles for each team or department. The same application receives different productivity ratings depending on who is using it. This role-specific classification eliminates one of the largest false positive sources: blanket rules that treat every employee's workflow identically. Configuration takes approximately 15 minutes per team and reduces classification-based false positives by an estimated 40-60%.
Configurable Alert Thresholds Per Team
Alert thresholds in eMonitor are set at the team level, not the company level. A sales team's idle time threshold can differ from an engineering team's threshold, reflecting the genuine differences in how these groups work. Managers configure thresholds that match their team's real workflow patterns rather than accepting defaults that apply to roles the defaults were never designed for.
Activity Timeline With Full Context
eMonitor's timeline view displays the complete picture of an employee's workday on a single screen: application usage, active and idle periods, productivity classifications, and screenshots, all arranged chronologically. This contextual view prevents the snapshot problem by showing managers the full story rather than isolated data points. A 15-minute idle period that looks suspicious in a summary report reveals its context on the timeline: it occurred between a 2-hour focused coding session and a team standup.
Employee-Facing Dashboards for Transparency
Employees can view their own activity data through personal dashboards. This transparency serves two purposes: employees can self-correct genuine productivity issues before they become management concerns, and they can proactively explain anomalies. When an employee sees that their monitoring data shows two hours of "idle time" during a day they spent on important phone calls, they can add context before a manager draws the wrong conclusion. Transparency turns monitoring from a one-way tool into a two-way conversation.
Privacy-First Design
eMonitor monitors only during configured work hours, not during personal time. Screenshot blur protects sensitive personal information that may appear on screen. These privacy protections are not just ethical, they are practical. When employees trust that monitoring respects boundaries, they are more forthcoming about explaining anomalies and providing the context that prevents false positives. Trust is the most effective false-positive prevention mechanism.
Building a Culture Where Monitoring Data Is Used Fairly
Technology alone does not prevent wrong conclusions from employee monitoring data. The organizational culture around how monitoring data is reviewed, discussed, and acted upon determines whether the system builds trust or destroys it.
Train Managers on Data Interpretation
Most managers receive training on how to use monitoring software (which buttons to click, which reports to run) but not on how to interpret the data correctly. Interpretation training covers the difference between correlation and causation, the limits of input-based measurement, the importance of context, and the dangers of confirmation bias. Managers who already suspect an employee is underperforming will subconsciously weight monitoring data that confirms their suspicion, a well-documented cognitive bias. Training helps managers recognize and counter this tendency.
Establish a "No Action Without Context" Policy
A formal policy requiring contextual investigation before any monitoring-based action creates institutional protection against false positives. The policy states that no performance conversation, disciplinary action, or termination decision can reference monitoring data unless the manager has: (1) reviewed at least two weeks of data patterns, not just a single instance, (2) checked the employee's output and deliverables, (3) considered contextual factors (calendar, projects, schedule), and (4) conducted a supportive conversation with the employee. This policy protects both the employee from unfair treatment and the organization from legal exposure.
Conduct Quarterly "Alert Audits"
Every quarter, review a random sample of 20-30 monitoring alerts from the previous 90 days. For each alert, determine: Was this a true positive or a false positive? If false positive, what configuration change would prevent it? If true positive, did the resulting action lead to a productive outcome? Track the false positive rate over time. Share the results with the management team. Organizations that conduct these audits consistently reduce their false positive rate by 40-50% within the first year (Deloitte Human Capital Trends, 2024).
Give Employees a Voice in the Process
Employees who can explain their monitoring data anomalies proactively, rather than defensively after an accusation, produce better outcomes for everyone. Create a simple mechanism (a comment field, a weekly self-report, or a dashboard annotation feature) where employees can add context to unusual activity patterns. eMonitor's employee-facing dashboard supports this by giving employees visibility into the same data their managers see, turning monitoring from a judgment tool into a collaboration tool.
Real-World Scenarios: When Monitoring Data Led to Wrong Conclusions
Understanding how employee monitoring false positives play out in practice makes the risks concrete. These scenarios, drawn from common patterns reported in workforce management literature, illustrate how easily wrong conclusions from productivity data can damage individuals and organizations.
Scenario 1: The "Unproductive" Top Performer
A mid-sized IT services firm implemented monitoring software with default settings. Within two months, the system flagged Sarah, a senior solutions architect, for averaging 2.5 hours of "non-productive" browsing daily. Her manager, under pressure to demonstrate ROI on the monitoring investment, placed Sarah on a performance improvement plan. In reality, Sarah spent those 2.5 hours reading technical documentation, reviewing open-source repositories, and researching cloud architecture patterns on sites the system classified as "non-productive." She was the team's highest performer by every output metric: client satisfaction, project delivery, and revenue generated. The PIP demoralized her, and she resigned within 60 days. Replacing a senior solutions architect cost the firm an estimated 150% of her annual salary in recruiting, onboarding, and lost client relationships.
Scenario 2: The Disability Discrimination Risk
A financial services company's monitoring system flagged an employee for consistently slower typing speed and longer idle periods between tasks compared to the team average. The manager, unaware of the employee's documented accommodation for a repetitive strain injury, included the monitoring data in a negative performance review. The employee filed a complaint with the EEOC, citing the monitoring data as evidence of discrimination based on disability. The company settled for an undisclosed amount and revised its monitoring policies to require accommodation-aware threshold configuration.
Scenario 3: The Team-Wide False Alarm
An e-commerce company migrated from Basecamp to Asana for project management. The monitoring system had not been updated to classify Asana as a productive application. For three weeks, every team member showed a dramatic decline in "productive" application usage and a corresponding spike in "uncategorized" time. The VP of Operations, reviewing only the summary dashboard, sent an all-hands email criticizing the team's declining productivity and threatening consequences. Employee satisfaction scores dropped 18 points in the next pulse survey. The cause was a 5-minute configuration update that nobody had made.
Monitoring Data Accuracy Checklist for Managers
Use this checklist before drawing any conclusions from employee monitoring data, especially before initiating performance conversations.
- Verify output first. Check deliverables, deadlines, and quality before examining activity data.
- Look for patterns, not incidents. Require at least 2 weeks and 3+ occurrences before flagging behavior.
- Check the calendar. Cross-reference idle time against scheduled meetings, training, and offsite events.
- Consider the role. Does this employee's job involve phone calls, offline work, or thinking time that monitoring cannot capture?
- Review classification accuracy. Are the apps flagged as "non-productive" actually non-productive for this specific role?
- Ask before assuming. A supportive, curious conversation ("I noticed X in the data; can you help me understand?") is always preferable to an accusation.
- Document your reasoning. If you do take action, record the multiple data sources and contextual factors you considered.
- Check for bias. Are your monitoring alerts disproportionately flagging employees of a particular demographic, schedule, or work style?
Conclusion: Employee Monitoring False Positives Are Preventable
Employee monitoring false positives are not an inevitable side effect of productivity tracking. They are the result of poor configuration, missing context, and managers who treat dashboard numbers as verdicts rather than starting points for investigation. Every wrong conclusion from monitoring data is preventable with the right combination of role-specific configuration, graduated alert thresholds, contextual review processes, and a culture that values fairness over surveillance theater.
The organizations that get monitoring right, the ones where employees trust the system rather than resent it, share three characteristics. They configure monitoring tools to reflect how their teams actually work, not how a software default assumes they work. They train managers to interpret data with nuance, recognizing that numbers without context are dangerous. And they treat monitoring as a support tool for better management, not as an automated judgment machine.
eMonitor is designed to support exactly this approach: role-specific classifications, configurable alert thresholds, contextual activity timelines, and employee-facing transparency dashboards. Trusted by 1,000+ companies and rated 4.8/5 on Capterra, eMonitor gives you accurate productivity insights while respecting the complexity of real human work.
The goal of monitoring is not to catch people doing something wrong. The goal is to understand how work happens so you can help your team do it better. That starts with making sure your data tells the truth.
Frequently Asked Questions
What are common false positives in employee monitoring?
Common employee monitoring false positives include flagging idle time during phone calls, marking research browsing as unproductive, triggering alerts when employees switch between tools rapidly, and misclassifying offline work as inactivity. These misinterpretations stem from rigid classification rules that ignore work context.
How do you avoid wrong conclusions from monitoring data?
Avoiding wrong conclusions from employee monitoring data requires combining quantitative metrics with qualitative context. Review flagged events against output quality, speak with employees before taking action, calibrate alert thresholds quarterly, and use role-specific productivity classifications rather than blanket rules.
Can monitoring data be misleading?
Employee monitoring data is frequently misleading when interpreted without context. A 2023 Gartner study found that 47% of managers who relied solely on monitoring dashboards made at least one incorrect performance judgment per quarter. Data accuracy depends on proper configuration, role-specific rules, and human review.
How do you tune monitoring alerts to reduce false positives?
Tuning employee monitoring alerts starts with establishing baseline activity patterns for each role over 30 days. Adjust idle time thresholds per department, whitelist role-specific applications, set graduated alert severity levels, and review alert accuracy monthly. eMonitor supports per-team configuration to match real workflows.
What is an acceptable false positive rate for employee monitoring?
An acceptable false positive rate for employee monitoring alerts sits between 5% and 10% after initial calibration. Organizations with rates above 15% experience alert fatigue, where managers stop reviewing notifications entirely. Regular threshold tuning and role-specific rules keep false positives within the target range.
Should managers confront employees based on monitoring data alone?
Managers should never confront employees based on monitoring data alone. Best practice requires corroborating monitoring flags with output quality, deadline adherence, peer feedback, and a direct conversation with the employee. Acting on uncorroborated data damages trust and exposes the organization to wrongful accusation claims.
How does idle time detection cause false positives?
Idle time detection causes employee monitoring false positives when the system only tracks keyboard and mouse input. Employees reading long documents, attending phone calls, whiteboarding, or thinking through complex problems register as idle despite being actively engaged. Adjusting idle thresholds by role reduces these errors by 40-60%.
Can employee monitoring software distinguish productive from unproductive browsing?
Employee monitoring software classifies websites using predefined categories, but these categories miss context. YouTube is unproductive for an accountant yet essential for a video editor researching techniques. eMonitor allows role-specific classification rules so the same website receives different productivity scores based on job function.
What legal risks come from acting on false positives?
Acting on employee monitoring false positives creates legal exposure including wrongful termination claims, discrimination suits if flagging disproportionately affects certain groups, and GDPR violations for unjustified data-based decisions under Article 22. Organizations need documented review processes to demonstrate fair, context-aware decision-making.
How often should monitoring alert thresholds be recalibrated?
Employee monitoring alert thresholds require recalibration at least quarterly, with additional reviews after organizational changes such as new tool adoption, team restructuring, or policy updates. Initial deployment needs weekly calibration for the first 30 days. eMonitor's alert configuration supports per-team, per-role threshold adjustments for ongoing tuning.
Sources
- Gartner, "Manager Effectiveness in Digital Monitoring Environments," 2023
- Society for Human Resource Management (SHRM), "Employee Trust and Monitoring Fairness," 2024
- Harvard Business Review, "The False Positive Problem in Employee Analytics," 2023
- Cornell University Institute for Compensation Studies, "Context and Classification in Workforce Monitoring," 2022
- American Psychological Association, "Knowledge Work and Digital Measurement Gaps," 2023
- Ariga, A. and Lleras, A., "Brief and Rare Mental Breaks Keep You Focused," Cognition, University of Illinois, 2011
- Forrester Research, "Graduated Alert Systems in Employee Monitoring," 2024
- Deloitte, "Human Capital Trends: Monitoring Audit Practices," 2024
- U.S. Equal Employment Opportunity Commission, "Guidance on Algorithmic Bias in Employment Decisions," 2023
- EU General Data Protection Regulation, Article 22, "Automated Individual Decision-Making"
Start Monitoring With Accuracy and Fairness
eMonitor gives you role-specific classification, configurable alerts, and transparent dashboards. Trusted by 1,000+ companies. Rated 4.8/5 on Capterra.