
Engineering Team Velocity & Productivity Metrics: What to Measure and What to Avoid
Engineering team velocity metrics tell only part of the productivity story. Developer productivity measurement combines delivery speed, code quality, system reliability, and team well-being into a framework that drives sustained output without burning out your best people. This guide covers the DORA, SPACE, and DX Core 4 frameworks, identifies the toxic metrics that backfire, and explains how activity monitoring data from tools like eMonitor supplements (not replaces) engineering-specific measurement.
Why Engineering Team Velocity Metrics Matter More in 2026
Engineering team velocity has become a boardroom topic. A 2024 survey by Gartner found that 78% of technology executives now list "developer productivity measurement" as a top-three priority, up from 42% in 2021. The reason is straightforward: engineering labor represents 30-50% of total operating costs at software-driven companies (Stripe Developer Coefficient Report, 2023), and leadership wants evidence that those dollars produce results.
But measuring developer productivity is not like measuring sales conversions or manufacturing throughput. Software engineering is creative, collaborative, and nonlinear. A developer who writes zero lines of code for two days while designing the right architecture may deliver more long-term value than one who ships 500 lines of hastily written features. This tension between measurability and reality sits at the center of every engineering metrics debate.
The question is not whether to measure engineering team efficiency. The question is which metrics capture genuine productivity and which ones create perverse incentives that destroy the very output they claim to optimize. Getting this wrong is expensive. According to a 2023 study by the University of Michigan, teams subjected to individual output metrics experienced a 17% decline in code review quality and a 23% increase in post-release defects within six months.

The McKinsey vs. Developer Community Debate: What It Revealed
In August 2023, McKinsey & Company published "Yes, You Can Measure Software Developer Productivity," a framework proposing that organizations track individual developer output using contribution analysis, code quality scores, and capacity allocation metrics. The developer community's response was immediate, vocal, and nearly unanimous in disagreement.
Kent Beck, co-creator of Extreme Programming and a foundational voice in software engineering, published a detailed rebuttal arguing that McKinsey's framework confused "activity" with "impact." Gergely Orosz, author of The Pragmatic Engineer newsletter (read by 500,000+ engineers), dissected how the proposed metrics would incentivize gaming: developers optimizing for visible output rather than system health, documentation, or mentoring.
The core criticism was not that measurement is bad. Engineers measure constantly: build times, test coverage, deployment frequency, uptime. The objection was that individual-level output metrics ignore the collaborative, systemic nature of software development. A developer who spends three hours helping a junior colleague debug a critical issue produces enormous value that no individual output metric captures.
What the debate revealed is a practical truth: engineering productivity measurement works at the team and system level, not at the individual contributor level. The frameworks that have earned engineering community trust (DORA, SPACE, DX Core 4) all measure team-level and system-level outcomes. That distinction matters for any organization choosing how to track developer velocity.
Team Productivity — This Week
Productive hours / day
Activity mix
▲ Deep-focus time up 19% after protecting daily focus blocks.
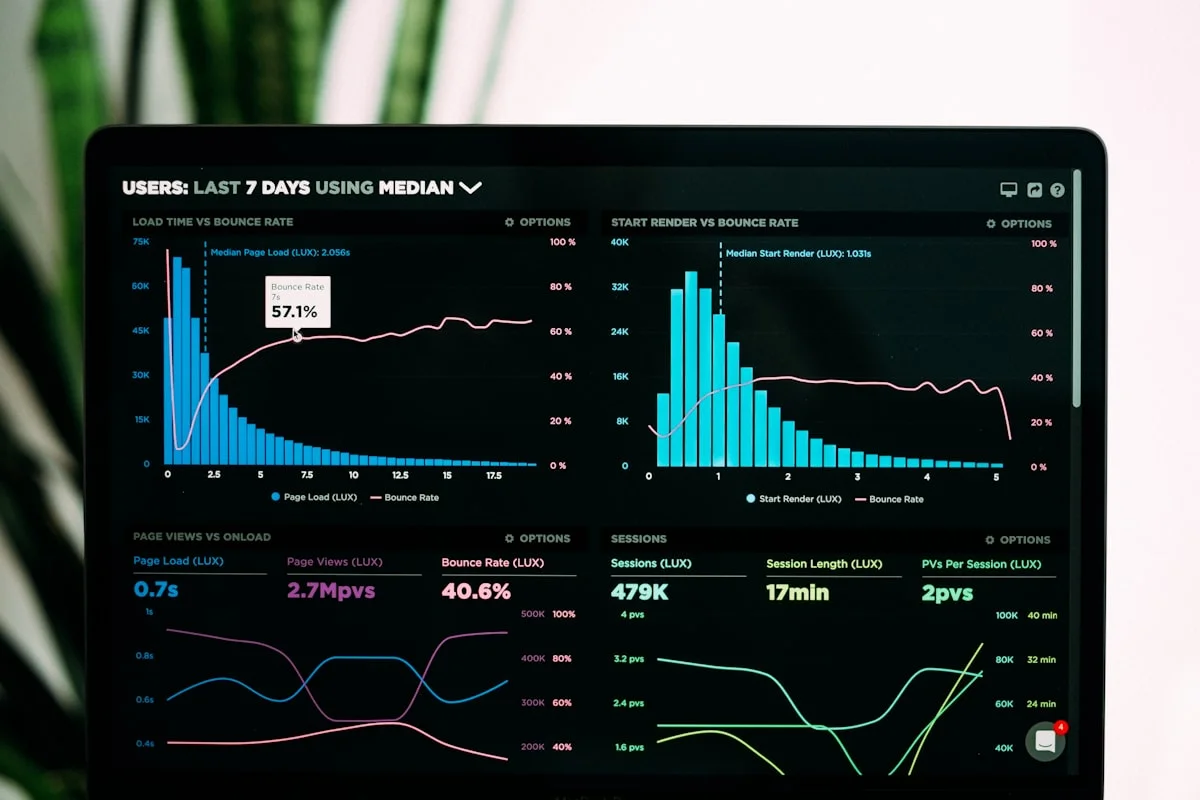
Illustrative eMonitor dashboard.
DORA Metrics for Engineering Teams: The Industry Standard
DORA metrics are four software delivery performance indicators developed by the DevOps Research and Assessment team, now part of Google Cloud. Published through the annual "Accelerate: State of DevOps" report (based on data from 36,000+ professionals across 7+ years), DORA metrics represent the most empirically validated framework for measuring engineering team velocity and delivery health.
The Four DORA Metrics
Deployment Frequency measures how often a team successfully releases to production. Elite teams deploy on demand, often multiple times per day. Low performers deploy between once per month and once every six months. Deployment frequency is a leading indicator of engineering agility: teams that deploy frequently have shorter feedback loops, smaller batch sizes, and lower risk per release.
Lead Time for Changes tracks the elapsed time from code commit to production deployment. Elite teams achieve lead times under one hour. Low performers take between one and six months. Short lead times indicate a healthy CI/CD pipeline, effective code review practices, and minimal bureaucratic overhead in the release process.
Change Failure Rate measures the percentage of deployments that cause a failure in production (requiring a hotfix, rollback, or patch). Elite teams maintain failure rates below 5%. High performers stay under 10%. This metric balances speed with quality: deploying frequently is valuable only if those deployments are stable.
Mean Time to Recovery (MTTR) tracks how quickly a team restores service after a production incident. Elite teams recover within one hour. Low performers take between one week and one month. MTTR reflects incident response maturity, monitoring coverage, and system observability.
Why DORA Works Where Other Metrics Fail
DORA metrics succeed because they measure outcomes (working software delivered to users) rather than outputs (lines of code, commits, or story points). A team gaming DORA metrics would need to deploy frequently, deploy reliably, and recover quickly from failures. That combination is indistinguishable from genuinely high performance. According to the 2023 Accelerate State of DevOps Report, elite DORA performers are 2.2x more likely to meet or exceed organizational performance goals than low performers.
| DORA Metric | Elite | High | Medium | Low |
|---|---|---|---|---|
| Deployment Frequency | On demand (multiple/day) | Weekly to monthly | Monthly to every 6 months | Less than every 6 months |
| Lead Time for Changes | Less than 1 hour | 1 day to 1 week | 1 week to 1 month | 1 to 6 months |
| Change Failure Rate | 0-5% | 5-10% | 10-15% | 16-30% |
| Mean Time to Recovery | Less than 1 hour | Less than 1 day | 1 day to 1 week | 1 week to 1 month |
The SPACE Framework: Developer Productivity Beyond Delivery Speed
SPACE is a developer productivity framework created in 2021 by researchers at GitHub, Microsoft Research, and the University of Victoria, published in the ACM Queue journal. Where DORA focuses on delivery pipeline health, SPACE broadens the lens to capture the full spectrum of what makes engineering teams productive.
The Five SPACE Dimensions
Satisfaction and Well-being measures how fulfilled developers feel about their work, tools, and team dynamics. This is captured through periodic surveys, not automated metrics. Research by Google's Project Aristotle found that psychological safety (a component of satisfaction) is the single strongest predictor of team effectiveness.
Performance measures the outcomes of developer work: reliability, absence of bugs, customer impact. This dimension aligns with DORA's change failure rate and MTTR but extends to include user-facing quality indicators like customer-reported defect rates.
Activity captures the countable actions developers take: commits, pull requests, code reviews, documentation updates. SPACE explicitly warns that activity metrics are meaningful only when combined with other dimensions. High activity with low performance suggests churn, not productivity.
Communication and Collaboration measures how effectively developers work together: code review turnaround time, knowledge sharing, onboarding speed for new team members. Software engineering is a team sport, and metrics that ignore collaboration miss half the picture.
Efficiency and Flow tracks whether developers can complete their work with minimal friction. This includes interruption frequency, build and test cycle times, toolchain quality, and the ratio of productive coding time to meetings and administrative work. A 2022 study published in IEEE Software found that developers spend only 52% of their work time writing or reviewing code; the rest goes to meetings (23%), administrative tasks (14%), and context switching recovery (11%).
The SPACE Rule: Measure at Least Three Dimensions
SPACE's key insight is that any single dimension, measured alone, distorts reality. Tracking only Activity rewards busywork. Tracking only Performance ignores developer well-being. Tracking only Satisfaction may miss declining delivery speed. The framework recommends capturing metrics across at least three of the five dimensions to create a balanced, manipulation-resistant view of engineering team productivity.
DX Core 4: The Developer Experience Approach to Engineering Velocity
DX Core 4 is a newer framework proposed by the DX research team (led by Abi Noda, formerly of GitHub) that distills developer productivity into four measurable dimensions. It builds on SPACE's foundation but adds a sharper emphasis on developer experience as a leading indicator of engineering output.
The Four DX Core 4 Metrics
Speed of Delivery measures how quickly the team ships completed work to production. This maps directly to DORA's deployment frequency and lead time metrics. Speed of delivery captures the velocity component that engineering managers most often ask about.
Effectiveness of Delivery tracks whether shipped work achieves its intended outcome. A feature deployed quickly but unused by customers scores high on speed and low on effectiveness. This dimension pushes teams to define success criteria before writing code.
Quality of Delivery measures the reliability and maintainability of shipped code. Indicators include change failure rate, test coverage trends, technical debt accumulation rate, and post-release defect density. Quality and speed together prevent the "ship fast, fix later" pattern that creates long-term drag on engineering velocity.
Developer Experience captures the subjective experience of building software within the organization: toolchain satisfaction, process friction, cognitive load, and day-to-day frustration. DX research shows that developer experience scores predict future velocity changes with a 3-to-6-month lead time. When developer experience drops, delivery speed follows within two quarters.
Toxic Engineering Metrics: What to Avoid Measuring
Not all metrics are harmless. Some actively damage engineering culture, code quality, and long-term delivery velocity. These "toxic metrics" share a common pattern: they measure individual activity rather than team outcomes, and they are easy to game in ways that reduce actual productivity.
Lines of Code (LoC)
Lines of code is the oldest and most discredited developer productivity metric. It penalizes efficient developers who solve problems with fewer, cleaner abstractions. A senior developer who refactors 2,000 lines into 400 lines of well-tested, reusable code has created more organizational value than a developer who writes 2,000 new lines of duplicated logic. Bill Gates reportedly said, "Measuring programming progress by lines of code is like measuring aircraft building progress by weight." Research from Microsoft supports this: teams incentivized by LoC metrics produce 30% more code but 40% more bugs per feature (Nagappan et al., Microsoft Research, 2005).
Raw Commit Counts
Commit frequency, when used as a performance metric, incentivizes developers to break work into artificially small commits. A developer who commits a one-line formatting change 20 times a day appears more productive than one who carefully architects a complex system integration in a single, well-tested commit. Commit frequency is useful as a team-level indicator of CI/CD pipeline health but destructive as an individual performance measure.
Hours Logged or Time at Desk
Research from Stanford economist John Pencavel demonstrates that productivity per hour drops sharply after 50 hours per week and falls to near zero after 55 hours. Measuring hours logged rewards presenteeism, not performance. A developer who solves a critical problem in four focused hours and leaves at 4 PM has outperformed one who spends nine hours switching between Slack, meetings, and distracted coding.
Individual Story Points
Story points measure the relative complexity of work as estimated by the team. Using individual story point totals as a performance metric distorts the estimation process. Developers inflate their estimates to score higher on the metric, or they avoid complex, high-value work (infrastructure improvements, documentation, mentoring) because it carries fewer points. Story points are a planning tool, not a performance metric.
Pull Request Volume
Like commit counts, raw pull request volume rewards quantity over quality. A developer who submits 15 small, poorly reviewed PRs is not more productive than one who submits 3 well-architected, thoroughly tested PRs. PR volume is useful for detecting bottlenecks in the review process but misleading as an individual productivity indicator.
How Activity Monitoring Data Supplements Engineering Team Velocity Metrics
Engineering-specific metrics like DORA and SPACE measure delivery outcomes and team health. Activity monitoring data from platforms like eMonitor fills a different gap: it reveals the work environment conditions that enable or undermine those outcomes. The two types of data are complementary, not competitive.
Focus Time Analysis
eMonitor tracks sustained periods of activity within development tools (IDEs, terminals, code review platforms) without interruption from communication applications. Research by Cal Newport, author of "Deep Work," and confirmed by a Microsoft Research study involving 10,000+ developers, shows that developers need uninterrupted blocks of at least 25 minutes to enter a productive flow state. Each interruption costs an average of 23 minutes to fully recover context (University of California, Irvine).
eMonitor's productivity analytics quantify how much daily focus time developers actually get. Teams that discover their developers average only 2.5 hours of daily focus time (against a benchmark of 4+ hours) can take action: consolidating meetings to specific days, establishing "no-meeting mornings," or configuring Slack notification schedules. The metric is not about measuring individual developer effort; it is about diagnosing organizational friction that reduces team-wide velocity.
Meeting Overhead Visibility
A 2022 study by Clockwise analyzed 100 million calendar events and found that the average developer attends 11.2 meetings per week, consuming 21.5 hours. That leaves barely half the work week for actual engineering. eMonitor's activity data reveals the actual ratio of time spent in communication tools (Slack, Teams, Zoom, Google Meet) versus development tools (VS Code, IntelliJ, terminal, Jira, GitHub). When engineering leaders see that their team spends 45% of work hours in non-development tools, the case for meeting reduction becomes data-driven rather than anecdotal.
Tool Utilization Patterns
Activity monitoring reveals which development tools the team actually uses versus which tools the organization pays for. If the team has licenses for three CI/CD platforms but 90% of activity flows through one, that is a cost optimization opportunity. If developers consistently bypass the official testing framework in favor of manual testing in the browser, that signals a toolchain friction problem that slows velocity.
After-Hours Work and Burnout Detection
eMonitor's work pattern data shows when developers consistently work outside their scheduled hours. The 2023 Accelerate State of DevOps Report found that teams with high burnout scores have 1.4x higher change failure rates and 60% longer lead times. Activity data catches after-hours patterns and shrinking focus blocks early, giving engineering managers a signal to intervene before self-reported satisfaction surveys reveal the problem.

A Practical Measurement Framework for Engineering Leaders
Choosing which engineering team velocity metrics to adopt requires matching frameworks to your team's maturity, size, and goals. Here is a practical, phased approach that combines engineering-specific metrics with activity data.
Phase 1: Foundation (Teams of Any Size)
Start with the two most accessible DORA metrics: deployment frequency and lead time for changes. These require minimal tooling (your CI/CD pipeline already tracks them) and provide immediate insight into delivery speed. Pair them with eMonitor's focus time analysis to understand whether your team's delivery speed is constrained by engineering challenges or by organizational interruptions.
Phase 2: Quality and Flow (Teams of 10+)
Add change failure rate and MTTR to complete the DORA picture. Introduce a quarterly developer satisfaction survey (even 5 questions covers the SPACE Satisfaction dimension). Layer in eMonitor's meeting-to-coding ratio to identify whether quality issues stem from rushed development caused by excessive meeting overhead.
Phase 3: Full Stack Measurement (Teams of 25+)
Implement the full SPACE or DX Core 4 framework. Capture code review turnaround time (Communication), build and test cycle times (Efficiency), and quarterly developer experience scores. Use eMonitor's trend data to correlate changes in work patterns with changes in delivery metrics. When focus time drops by 20% and lead time increases by 15% in the same sprint, you have identified a causal relationship rather than just a data point.
What Not to Do at Any Phase
Do not rank individual developers by any metric. Do not tie metric targets to compensation. Do not set arbitrary targets ("we must deploy 10 times per week") without understanding your baseline. Do not use activity monitoring data as a performance evaluation input. These practices consistently backfire, according to research by Dr. Nicole Forsgren (co-creator of DORA) and every credible engineering productivity study published in the last decade.
Five Common Velocity Measurement Pitfalls and How to Avoid Them
1. Confusing velocity with productivity. Sprint velocity (story points per sprint) measures throughput, not value. A team completing 80 points per sprint on low-impact features is less productive than a team completing 40 points on features that drive 50% of revenue. Always pair velocity with outcome metrics: adoption rates, revenue impact, customer satisfaction, or defect reduction.
2. Measuring individuals instead of teams. Software is built collaboratively. The developer who mentors two junior engineers, writes thorough documentation, and conducts careful code reviews generates enormous value that no individual metric captures. All credible frameworks (DORA, SPACE, DX Core 4) are explicitly designed for team-level measurement.
3. Optimizing a single metric. Goodhart's Law states: "When a measure becomes a target, it ceases to be a good measure." A team told to maximize deployment frequency will deploy more often, potentially at the cost of stability. A team told to minimize change failure rate will slow deployments to avoid risk. Multiple balanced metrics prevent single-metric gaming.
4. Ignoring developer experience. Developer experience is a leading indicator of engineering velocity. When developers report increasing friction with tools, processes, or team dynamics, delivery speed declines within 3-6 months (DX Research, 2024). Ignoring experience data means you only see velocity drops after they happen, when the underlying cause has been compounding for months.
5. Treating metrics as a substitute for management. Metrics inform decisions; they do not make decisions. A declining velocity trend is a signal to investigate, not an automatic trigger for process changes. The most effective engineering leaders use metrics to start conversations: "I noticed our lead time increased by 30% this quarter. What changed?" That conversation reveals context that no dashboard provides.
Sprint Velocity: How to Use It Without Weaponizing It
Sprint velocity (the number of story points a team completes per sprint) remains the most widely used engineering metric despite its well-documented limitations. According to the 2024 State of Agile Report by Digital.ai, 87% of agile teams track velocity as a planning input. The problem is not velocity itself; the problem is how organizations misuse it.
Velocity as a Planning Tool
Velocity is most valuable as a planning input, not a performance metric. A team that consistently completes 35-40 story points per sprint can reliably forecast that a 120-point epic will take approximately 3 sprints. This predictability is useful for project managers, product owners, and stakeholders who need delivery timelines. Using velocity for planning is legitimate and widely recommended by the Scrum Guide and the Agile Alliance.
When Velocity Becomes Toxic
Velocity turns toxic when leadership treats it as a performance target. "Increase velocity by 20% this quarter" sounds reasonable but produces predictable dysfunction: teams inflate story point estimates so the same work yields higher numbers. They avoid technical debt reduction (which does not carry points). They skip code reviews and testing to complete more stories within the sprint. Within two to three quarters, the team reports higher velocity while actual delivery quality, system reliability, and developer morale all decline.
The Rolling Average Approach
If your organization tracks velocity, use a 4-to-6-sprint rolling average. This smooths out natural sprint-to-sprint variation (holidays, on-call rotations, conference attendance) and reveals genuine trends. A declining rolling average over three or more data points signals a real problem worth investigating. A single low sprint is noise, not signal.
Engineering Velocity Metrics for Remote and Distributed Teams
Remote and distributed engineering teams face unique measurement challenges. Time zone differences create asynchronous collaboration patterns that traditional metrics do not capture. A 2023 GitLab survey of 5,000+ remote developers found that 67% of remote engineers report "async collaboration quality" as their top productivity concern, ahead of tooling (54%) and meeting overhead (48%).
What Changes for Remote Teams
Code review turnaround time (a key SPACE Communication metric) naturally increases in distributed teams because reviewers may be asleep when a PR is submitted. Lead time for changes extends for the same reason. These increases are structural, not pathological, and should not be interpreted as declining productivity. Remote engineering teams should benchmark against other distributed teams, not against co-located teams with instant hallway code reviews.
eMonitor's activity data provides particular value for remote engineering teams. When a distributed team's focus time data shows that developers in one time zone consistently lose two hours per day to meetings scheduled during their productive morning hours, the fix is a scheduling policy change, not a productivity intervention. Activity data reveals these hidden structural problems that DORA metrics alone cannot diagnose.
Async-Friendly Metrics
For distributed teams, add two metrics to your standard framework: async response time (median time between a code review request and the first review comment) and documentation update frequency (a proxy for knowledge sharing in async environments). These metrics recognize that distributed teams depend on written communication, and that slow async responses create the same bottleneck as excessive meetings in co-located teams.
Step-by-Step: Implementing an Engineering Velocity Measurement Program
Step 1: Audit your current data sources. Before selecting metrics, inventory what data you already collect. Most teams have CI/CD pipeline data (deployment frequency, lead time), version control data (commits, PRs, review turnaround), and incident management data (MTTR, failure rates). You may already have 60% of what DORA requires without adding any new tools.
Step 2: Choose your primary framework. For teams focused on delivery speed and reliability, start with DORA. For teams concerned about developer experience and retention, start with SPACE or DX Core 4. The frameworks overlap significantly; DORA metrics appear within both SPACE and DX Core 4.
Step 3: Establish baselines, not targets. Measure your current state for 6-8 weeks before setting any goals. Baselines prevent the common mistake of setting arbitrary targets based on industry benchmarks that may not apply to your codebase, team size, or domain complexity.
Step 4: Add activity data for context. Deploy eMonitor to capture focus time, meeting overhead, and tool utilization patterns. Configure productivity classifications so development tools (IDEs, terminals, code review platforms) are categorized correctly for your team's workflow. This layer adds "why" context to the "what" that engineering metrics measure.
Step 5: Review metrics at the right cadence. DORA metrics: review weekly in a 5-minute standup format. Velocity: review at sprint retrospectives using 4-6 sprint rolling averages. SPACE/DX Core 4 satisfaction and experience: survey quarterly. Activity data (focus time, meeting ratios): review monthly in an engineering operations meeting.
Step 6: Act on insights, not numbers. Every metric review should produce either a specific action or an explicit decision to take no action. "Our lead time increased by 25% this month. Investigation shows a new compliance review step was added. The step adds 4 hours per deployment but prevents regulatory risk. Decision: accept the increase and update our baseline." That is measurement working as intended.

See Your Engineering Team's Focus Time and Activity Patterns
eMonitor shows you where developer hours actually go: coding, meetings, communication tools, and context switching. Trusted by 1,000+ companies.
The Case for Balanced Measurement: Engineering Metrics Plus Activity Data
Engineering metrics and activity monitoring data answer different questions. DORA tells you how well the team delivers software. SPACE and DX Core 4 tell you how the team experiences the delivery process. Activity monitoring from eMonitor tells you what the work environment looks like on a daily basis.
Consider a scenario: a team's DORA lead time increases from 2 days to 5 days over one quarter. DORA tells you that delivery slowed. SPACE satisfaction surveys (administered quarterly) show no change. But eMonitor's weekly activity data shows that average daily focus time dropped from 4.2 hours to 2.8 hours over the same period, coinciding with three new recurring meetings added to the team's calendar. The root cause is clear: meeting overhead is consuming engineering capacity.
Without activity data, the engineering manager might investigate code review bottlenecks, CI/CD pipeline issues, or technical debt. Those investigations would waste weeks because the actual problem is organizational, not technical. Activity monitoring data shortens the diagnostic cycle by revealing work environment changes in near real-time.
This is the correct role for monitoring in engineering teams: not as a developer performance evaluation tool, but as an organizational health diagnostic that complements engineering-specific metrics.
What High-Performing Engineering Teams Measure (and What They Do Not)
| Measured by High Performers | Avoided by High Performers |
|---|---|
| Deployment frequency (team-level) | Individual commit counts |
| Lead time for changes (team-level) | Individual lines of code |
| Change failure rate | Individual story points completed |
| Mean time to recovery | Hours logged per day |
| Code review turnaround time (team-level) | Keystrokes per hour |
| Developer satisfaction scores | Time spent at desk or online |
| Focus time per day (aggregate) | PR volume per developer |
| Meeting-to-coding ratio (team-level) | Badge swipe/login frequency |
| Test coverage trends | Bug count attributed to individuals |
| Onboarding time for new engineers | Stack-ranking developers by output |
The pattern is consistent: high-performing engineering teams measure system-level outcomes and team-level conditions. They avoid individual output metrics entirely. This approach aligns with research from Google's Project Aristotle (2015), Microsoft's developer productivity studies (2019-2024), and the annual Accelerate State of DevOps reports.
Engineering Team Velocity Metrics FAQ
How do you measure engineering team velocity?
Engineering team velocity is measured by tracking story points completed per sprint over a rolling average. DORA metrics complement velocity by measuring deployment frequency, lead time for changes, change failure rate, and mean time to recovery. Velocity alone is insufficient; pairing it with quality and flow metrics gives a complete picture.
What are DORA metrics for developers?
DORA metrics are four software delivery performance indicators developed by Google's DevOps Research and Assessment team. They measure deployment frequency, lead time for changes, change failure rate, and mean time to recovery. Elite teams deploy on demand, with lead times under one hour, sub-5% failure rates, and recovery within one hour.
Should you track developer keystroke counts?
eMonitor recommends against using raw keystroke counts as a developer productivity metric. A developer solving a complex architecture problem may type 50 lines in a day that save the team 5,000 lines of technical debt. Keystroke intensity data is useful for detecting engagement patterns and burnout risk, not for measuring individual output.
How do you use monitoring data for engineering teams?
eMonitor's activity data supplements engineering metrics by revealing focus time patterns, meeting load ratios, and tool usage across development environments. Teams use this data to protect deep work blocks, reduce context switching, and identify process bottlenecks. The data supports team-level decisions, not individual performance scoring.
What is the SPACE framework for developer productivity?
SPACE is a developer productivity framework created by researchers at GitHub, Microsoft, and the University of Victoria. It measures five dimensions: Satisfaction, Performance, Activity, Communication, and Efficiency. SPACE recommends capturing metrics across at least three dimensions to avoid single-metric distortion.
What are DX Core 4 metrics?
DX Core 4 metrics are four developer experience indicators: speed of delivery, effectiveness of delivery, quality of delivery, and developer experience (satisfaction and friction). DX Core 4 builds on SPACE by emphasizing subjective developer experience as a leading indicator of engineering output.
Why is lines of code a bad productivity metric?
Lines of code penalizes efficient developers who solve problems with fewer, cleaner abstractions. A senior developer who refactors 2,000 lines into 400 lines has created more value than one who writes 2,000 new lines of duplicated logic. Lines of code also incentivizes code bloat, increasing maintenance cost and bug surface area.
How do you measure developer focus time?
eMonitor measures developer focus time by tracking sustained activity within development tools (IDEs, terminals, code review platforms) without interruption from communication apps. A focus block is 25 or more uninterrupted minutes in coding-related applications. Teams averaging 4+ hours of daily focus time ship 50% more features per sprint.
What is the McKinsey developer productivity debate?
In 2023, McKinsey published a framework for measuring developer productivity that drew sharp criticism from the software engineering community. Critics including Kent Beck and Gergely Orosz argued the framework relied on individual output metrics that ignore collaboration, code quality, and system-level outcomes. The debate highlighted that engineering productivity requires context-aware measurement.
How often should you review engineering velocity metrics?
Engineering velocity metrics are most useful on a 4-to-6-sprint rolling average. Weekly reviews of DORA metrics catch deployment pipeline problems early. Monthly reviews of SPACE or DX Core 4 dimensions reveal systemic patterns. Avoid daily metric reviews, which create noise and encourage short-term optimization over sustained delivery.
Can monitoring software replace engineering-specific metrics?
Monitoring software does not replace engineering-specific metrics like DORA, SPACE, or velocity. eMonitor supplements these frameworks by providing activity-level data that engineering metrics miss: focus time distribution, meeting overhead, tool utilization, and work pattern trends. The combination produces a more complete productivity picture than either source alone.
What metrics indicate engineering team burnout?
Engineering team burnout indicators include declining velocity over three or more sprints, rising change failure rates, increased after-hours work, shorter focus time blocks, and lower satisfaction scores. eMonitor's activity data detects after-hours patterns and shrinking focus blocks before self-reported surveys capture the problem.
Conclusion: Engineering Team Velocity Metrics That Actually Work
Engineering team velocity metrics serve their purpose only when they measure team-level outcomes, balance speed with quality, and include developer experience as a leading indicator. The DORA, SPACE, and DX Core 4 frameworks provide empirically validated structures for this measurement. Toxic metrics like lines of code, individual commit counts, and raw hours logged damage the engineering culture they claim to measure.
Activity monitoring from eMonitor plays a specific, complementary role: it reveals the work environment conditions (focus time, meeting overhead, tool utilization, after-hours patterns) that explain why delivery metrics move. This is not a replacement for engineering-specific measurement. It is the contextual layer that makes engineering metrics actionable.
Start with DORA. Add SPACE or DX Core 4 as your team matures. Use eMonitor's activity data to diagnose organizational friction before it shows up in delivery numbers. Measure what matters, ignore what does not, and treat your metrics as conversation starters rather than scorecards.
Give Your Engineering Leaders the Activity Data They Need
eMonitor shows focus time, meeting overhead, and tool usage patterns across your development team. No keystroke scoring. No individual rankings. Just the data that helps engineering managers make better decisions.
Sources
- Gartner, "CIO and Technology Executive Survey: Developer Productivity Priorities," 2024
- Stripe, "The Developer Coefficient: Software Engineering Efficiency Report," 2023
- University of Michigan, "Effects of Individual Output Metrics on Software Quality," 2023
- Google Cloud / DORA, "Accelerate: State of DevOps Report," 2023
- Forsgren, N., Humble, J., Kim, G., "Accelerate: The Science of Lean Software and DevOps," IT Revolution Press, 2018
- Forsgren, N., Storey, M.A., Maddila, C., et al., "The SPACE of Developer Productivity," ACM Queue, 2021
- DX Research, "DX Core 4 Framework: Measuring Developer Productivity," 2024
- Nagappan, N., Ball, T., Zeller, A., "Mining Metrics to Predict Component Failures," Microsoft Research, 2005
- Pencavel, J., "The Productivity of Working Hours," Stanford University, IZA Discussion Paper No. 8129, 2014
- Mark, G., Gudith, D., Klocke, U., "The Cost of Interrupted Work: More Speed and Stress," University of California, Irvine, 2008
- Clockwise, "The State of Meetings Report: Developer Meeting Load Analysis," 2022
- IEEE Software, "How Developers Spend Their Time," 2022
- Digital.ai, "17th Annual State of Agile Report," 2024
- GitLab, "Remote Work Report: Developer Collaboration Patterns," 2023
- Google, "Project Aristotle: Understanding Team Effectiveness," 2015