
Marketing Team Productivity Monitoring: Metrics, Workflows & Campaign Time Tracking
Marketing team productivity tracking is the practice of measuring how marketing professionals allocate their work hours across creative production, campaign management, administrative tasks, and strategic planning. For most marketing departments, the core challenge is not whether people are "working hard enough" but whether the team's hours flow toward high-value creative and strategic work or leak into meetings, email, and internal reporting. This guide shows you how to use activity data to protect creative time, benchmark marketing department efficiency, and make better resourcing decisions.
Marketing leaders face a measurement paradox. You need data to justify headcount, defend budgets, and allocate resources across channels, but the wrong metrics punish the very behaviors that produce great work. A designer spending 90 minutes staring at a mood board is not unproductive; she is in the early phase of a creative process that produces a brand campaign worth six figures in pipeline. Marketing team productivity tracking, done correctly, measures time allocation patterns rather than counting keystrokes or policing screen time.
Workfront's 2024 State of Work report found that marketers spend only 36% of their time on the creative and strategic work they were hired to do. The remaining 64% goes to meetings, status updates, internal approvals, and administrative overhead. That ratio represents an enormous waste of specialized talent. A 12-person marketing team with an average salary of $75,000 per person is spending the equivalent of $576,000 annually on work that does not require marketing expertise.
The purpose of monitoring in a marketing department is not to make people work faster. It is to identify where non-creative work is consuming creative capacity, and then fix the workflows, meeting culture, and approval processes that cause the imbalance.
Why Marketing Teams Need Productivity Tracking More Than Most Departments
Marketing departments have a unique vulnerability to admin overload because they sit at the intersection of nearly every other function. Sales needs campaign updates. Product needs launch support. Finance needs spend reports. Executives need performance dashboards. Every request pulls marketers away from the creative and strategic work that generates pipeline and revenue.
But how does this cross-functional demand translate into measurable time loss?
Marketing team productivity tracking reveals the answer in hard numbers. A 2024 CoSchedule study found that the average marketing professional context-switches 13 times per day, with each switch costing 23 minutes of refocused attention (University of California, Irvine research). That adds up to roughly 5 hours of lost focus time per week per marketer. Multiply that across a 10-person team, and you lose 50 hours of creative capacity weekly to fragmentation alone.
Marketing departments also carry a measurement gap that other functions do not. Engineering teams have sprint velocity, code commits, and deployment frequency. Sales teams have pipeline value, close rates, and call volume. Marketing teams often lack equivalent real-time metrics for how time converts into output. Activity monitoring closes that gap by showing exactly how hours distribute across tool categories, campaign phases, and work types.
Three specific problems make marketing team productivity tracking essential in 2026:
- Martech stack sprawl: The average marketing department uses 12 to 20 tools (Gartner Marketing Technology Survey, 2024). Without usage data, teams pay for tools nobody opens and miss training gaps on tools that would save hours.
- Meeting culture erosion: Marketing teams average 12.4 hours per week in meetings (Atlassian Workplace Research, 2024). Top-performing teams stay below 8 hours. Activity data exposes meeting overload before it becomes chronic.
- Remote collaboration overhead: Distributed marketing teams spend 28% more time on coordination than co-located teams (Buffer State of Remote Work, 2024). Monitoring data identifies which collaboration patterns add value versus which are pure overhead.
The Creative-to-Admin Ratio: The Single Most Important Marketing Productivity Metric
The creative-to-admin ratio measures the percentage of work hours a marketing team member spends in creative and strategic tools versus administrative and communication applications. This ratio is the single most diagnostic metric for marketing department efficiency because it directly reflects whether specialized talent is being used for specialized work.
What does a healthy creative-to-admin ratio look like in practice?
Marketing team productivity tracking benchmarks from Workfront, CoSchedule, and Adobe's 2024 research converge on a consistent pattern. High-performing marketing teams maintain a 60:40 creative-to-admin ratio or better. Average teams fall between 40:60 and 50:50. Underperforming teams drop below 35:65, meaning their marketers spend less than a third of their day on the work they were hired to do.

eMonitor calculates this ratio automatically by classifying application usage into categories. Creative tools (Adobe Creative Cloud, Figma, Canva, WordPress, Google Docs for content writing), campaign management tools (Google Ads, Meta Business Suite, HubSpot, Mailchimp), and analytics platforms (Google Analytics, Tableau, Looker Studio) count as productive, high-value time. Administrative applications (email clients, Slack, Microsoft Teams, calendar apps, spreadsheets for internal reporting) count as admin overhead.
The classification is configurable. A marketing operations manager who lives in spreadsheets building attribution models is doing strategic work, not admin. eMonitor allows managers to customize productivity classifications by role, so the same application can be "creative" for one person and "admin" for another. This flexibility is critical for marketing teams because the same tool (Google Sheets, for example) serves completely different purposes for a media buyer building a budget model versus a coordinator updating a status tracker.
How to Improve a Declining Creative-to-Admin Ratio
When eMonitor's weekly reports show a team member's creative ratio dropping, the cause almost always falls into one of four categories:
- Meeting inflation: Recurring meetings added over months without retiring obsolete ones. Check the activity timeline for meeting application time (Zoom, Teams, Google Meet) and compare against the previous quarter. If meeting hours increased by 20% or more, audit every recurring meeting for continued relevance.
- Approval bottlenecks: Waiting for internal approvals forces marketers to context-switch into email and Slack to chase feedback. The symptom in eMonitor data is frequent short sessions in creative tools interrupted by communication app spikes. The fix is async approval workflows with clear SLAs.
- Reporting overload: Manual report building consumes hours that automated dashboards could eliminate. If a content marketer spends 4 hours per week in Google Sheets building performance reports, that is 4 hours not spent writing. Invest in automated reporting tools or dedicate marketing operations capacity to report generation.
- Scope creep from other departments: Sales enablement requests, product launch support, and executive presentation prep all pull marketers into admin-heavy work. Activity data quantifies the cost, giving marketing leaders evidence to negotiate boundaries or request additional headcount.
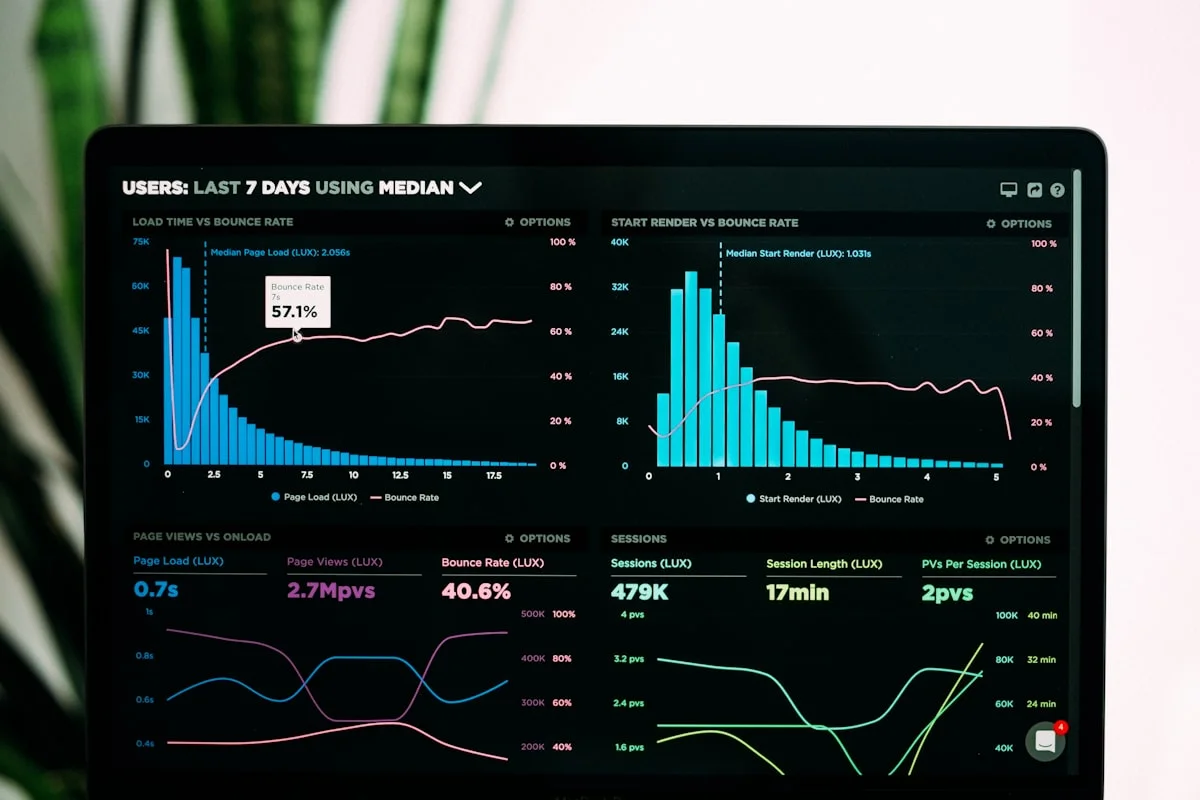
Team Productivity — This Week
Productive hours / day
Activity mix
▲ Deep-focus time up 19% after protecting daily focus blocks.
Illustrative eMonitor dashboard.
Campaign Time Allocation: Where Marketing Hours Actually Go
Campaign time allocation tracking answers a question that most marketing leaders cannot answer with precision: how many hours does each campaign type actually require from planning to launch?
Marketing team productivity tracking at the campaign level requires combining project-level time tagging with automatic activity data. eMonitor supports both approaches. Team members can tag their hours to specific campaigns or projects, while the platform simultaneously records which applications they use. This dual-tracking approach catches work that manual time logs miss, especially the small context switches (a 10-minute email thread about Campaign A, a quick Creative Cloud session to resize an asset for Campaign B) that add up to significant hours over a month.
Here is what campaign-level time data reveals in practice:
| Campaign Type | Avg. Hours (Industry) | Typical Split |
|---|---|---|
| Email nurture sequence (5 emails) | 40 to 60 hours | 45% writing, 25% design, 20% setup/QA, 10% reporting |
| Paid social campaign (single channel) | 25 to 40 hours | 30% creative, 25% audience/targeting, 25% optimization, 20% reporting |
| Blog content (long-form, 2,500+ words) | 12 to 20 hours | 50% research/writing, 20% editing, 15% SEO optimization, 15% graphics/formatting |
| Product launch (full GTM) | 200 to 400 hours | 30% creative production, 25% coordination, 25% channel execution, 20% reporting |
| Webinar (end-to-end) | 60 to 100 hours | 25% content, 25% promotion, 25% logistics, 25% follow-up |
When your actual campaign hours consistently exceed these benchmarks, the excess almost always comes from coordination and approval overhead, not from creative production time. eMonitor's project-level reports isolate exactly where the overrun occurs, giving marketing directors actionable data to fix process bottlenecks rather than pressuring team members to "work faster."
Martech Stack Utilization: Stop Paying for Tools Nobody Uses
Marketing technology spending reached $321 billion globally in 2024 (Statista), yet Gartner's 2024 CMO Spend Survey found that marketing teams utilize only 33% of their martech stack's capabilities. That means two-thirds of your software investment sits idle, partially adopted, or duplicated across teams.
How does application monitoring help marketing departments reduce martech waste?
eMonitor's app and website usage analytics show exactly which tools each team member uses, for how long, and how frequently. This data answers three questions that marketing operations leaders struggle with:
- Which tools are adopted vs. shelf-ware? If you pay $500/month for a social scheduling tool but only two of eight social media marketers use it (the rest post natively), that is a training problem or a tool-fit problem. Activity data exposes it within the first week.
- Where do tools overlap? Marketing teams frequently run parallel tools for the same function: Canva and Adobe CC for design, Asana and Monday.com for project management, Mailchimp and HubSpot for email. Usage data reveals which tool the team actually prefers, enabling consolidation.
- Who needs training? When a designer spends 6 hours in Photoshop completing a task that Figma handles in 90 minutes, the time gap signals a training opportunity. eMonitor's time-per-application reports reveal these efficiency gaps without requiring anyone to self-report.
A 2024 Forrester study estimated that enterprises waste $4,200 per employee annually on unused or underused SaaS subscriptions. For a 15-person marketing department, that is $63,000 per year recoverable through usage-based tool rationalization. Activity monitoring pays for itself on software savings alone.
Identifying and Fixing Meeting Overload in Marketing Departments
Meeting overload is the most common productivity problem in marketing departments because marketing teams coordinate with more internal stakeholders than nearly any other function. Content teams meet with product and sales. Demand gen meets with sales ops and finance. Brand meets with executives and agencies. Every collaboration touch point becomes a recurring meeting that rarely gets retired.
Marketing team productivity tracking through eMonitor's activity timeline reveals meeting patterns that calendars alone do not capture. A calendar shows scheduled meeting time. Activity data shows actual meeting time, including the unscheduled "quick syncs" and screen-share sessions that never appear on a calendar but consume hours every week.

Atlassian's 2024 Workplace Research found that meeting time increased 252% since early 2020, with marketing and sales teams absorbing the largest share. The same research showed that 72% of professionals consider at least half their meetings unnecessary. For a 10-person marketing team averaging 12 hours of meetings per week, cutting meeting time by 30% recovers 36 hours of creative capacity weekly, equivalent to nearly one full-time employee's productive output.
eMonitor helps marketing leaders run a data-driven meeting audit. Pull the weekly activity report, sort by meeting application usage, and look for three warning signs:
- Any team member above 15 hours/week in meeting apps. This person has lost the ability to do deep creative work. Evaluate which meetings they attend versus which they could receive notes from.
- Meeting time climbing quarter over quarter. A 10% quarterly increase means meetings will double in less than two years. Establish a meeting budget (maximum hours per person per week) and enforce it.
- Creative tool time inversely correlating with meeting time. When Figma and Adobe CC usage drops in the same weeks that Zoom usage spikes, you have direct evidence that meetings are displacing creative production.
Productivity Tracking for Remote and Hybrid Marketing Teams
Remote marketing teams face an amplified version of every challenge covered above. Coordination overhead increases because casual desk-side conversations become scheduled video calls. Meeting time rises because remote collaboration defaults to synchronous video rather than async channels. And creative focus time fragments because home environments introduce interruptions that offices (at their best) are designed to minimize.
But does remote monitoring data tell a different story than what managers assume?
Stanford's ongoing Working from Home research found that remote workers are 13% more productive than in-office counterparts when measured by output. However, the same research showed that remote workers struggle more with collaboration tasks and report higher feelings of isolation. Marketing team productivity tracking for remote and hybrid teams needs to account for both realities.
eMonitor provides equal visibility for remote, hybrid, and in-office marketing teams. The desktop agent tracks activity identically regardless of location, normalizing time zones for distributed teams so a marketer in New York and a designer in London appear on the same unified dashboard. This consistency is essential for hybrid marketing teams where some members work from office three days a week while others are fully remote.
Three practices specific to remote marketing team monitoring:
- Track collaboration-to-creation ratio by location. Remote marketers often over-index on Slack and email to compensate for reduced face-time. If remote team members show 40% communication app usage versus 25% for in-office members, the remote group may need structured async communication norms rather than more meetings.
- Compare deep work windows. Remote marketers often do their best creative work during non-traditional hours (early morning, late evening). Activity timelines reveal individual peak productivity windows, enabling managers to schedule meetings outside those periods.
- Monitor for over-utilization, not under-utilization. Buffer's 2024 State of Remote Work report found that 22% of remote workers struggle to stop working at the end of the day. For creative professionals, this leads to burnout that degrades output quality long before it shows up in output volume. eMonitor's work-life balance alerts flag employees consistently working beyond configured hours.

See Where Your Marketing Team's Hours Actually Go
Start a free trial and get your first creative-to-admin ratio report within 48 hours. No credit card required.
Seven Marketing Team Productivity Metrics Worth Tracking
Marketing team productivity tracking works best when you measure a small set of metrics consistently rather than drowning in dashboards. Here are the seven metrics that give marketing leaders the clearest picture of team efficiency and capacity.
1. Creative-to-admin time ratio. Already covered in depth above. Target: 60:40 or better. eMonitor calculates this from application classification data. Review weekly; act when it drops below 50:50 for any team member for two consecutive weeks.
2. Hours per deliverable. Track the total hours invested per deliverable type (blog post, email campaign, paid ad set, landing page). Over time, this metric reveals whether your team is becoming more efficient with practice or losing efficiency to process bloat. A content writer averaging 15 hours per long-form blog post in Q1 and 22 hours in Q3 has a process problem, not a skill problem.
3. Campaign delivery on-time rate. Cross-reference eMonitor's project time data with your project management tool's deadline tracking. Marketing teams averaging below 75% on-time delivery typically have an estimation problem (underestimating hours required) or a capacity problem (too many campaigns for the team size). Time tracking data distinguishes between the two.
4. Tool utilization rate. Percentage of purchased martech tools actively used by the team weekly. Target: 80% or above. Below 60% indicates significant software waste or adoption failures.
5. Meeting time per person per week. Track via eMonitor's activity timeline. Target: 8 hours or fewer for individual contributors, 12 hours or fewer for managers. Review monthly and audit any team member above these thresholds.
6. Context switches per day. eMonitor's activity data shows how frequently team members switch between applications and tasks. Marketing professionals averaging more than 15 application switches per hour are likely in a reactive, fragmented work pattern. Fewer than 8 switches per hour suggests sustained focus time.
7. Overtime and after-hours work. Track hours worked beyond the standard schedule. Marketing teams frequently normalize "crunch time" around launches and end-of-quarter pushes, but chronic overtime signals inadequate staffing or poor project scoping. eMonitor's alerts flag employees consistently working beyond configured hours, catching burnout risk early.
How to Set Up Marketing Team Productivity Tracking in eMonitor
Marketing team productivity tracking setup in eMonitor takes less than 30 minutes for a department of any size. Here is the step-by-step process optimized for marketing teams.
Step 1: Install the desktop agent (2 minutes per machine). eMonitor's lightweight agent installs on Windows, macOS, Linux, and Chromebook. For marketing teams using creative-heavy machines (Mac Pro, high-RAM workstations), the agent uses less than 1% of system resources and does not interfere with Adobe CC, video rendering, or other CPU-intensive creative tools.
Step 2: Configure productivity classifications by role (15 minutes). This is the most important setup step for marketing teams. Create role-based classification profiles:
- Content/copywriters: Google Docs, WordPress, Grammarly, research browsers = productive. Email, Slack = neutral.
- Designers: Adobe CC, Figma, Canva, Sketch = productive. File management, email = neutral.
- Demand gen/paid media: Google Ads, Meta Business Suite, LinkedIn Campaign Manager, analytics platforms = productive.
- Marketing ops: HubSpot, Marketo, Salesforce, spreadsheets for attribution modeling = productive.
- Social media managers: Native social platforms during scheduled posting windows = productive. Social platforms outside posting windows = neutral.
Step 3: Set up project-level time tagging (5 minutes). Create project entries for each active campaign, retainer client, or ongoing initiative. Team members tag their work sessions to the relevant project, giving you campaign-level time allocation data alongside automatic activity tracking.
Step 4: Configure alerts and thresholds (5 minutes). Set alerts for overtime (configurable threshold), low creative-to-admin ratio (below 45% for two consecutive days), and idle time (adjustable for roles where "thinking time" is productive, like strategists and copywriters).
Step 5: Communicate transparently with the team (essential, not optional). Share what you are tracking and why. Marketing teams respond well to the framing: "We are measuring how our time distributes across work types so we can protect creative time, cut unnecessary meetings, and make better resourcing decisions." Share the dashboard with team members so they can see their own data. Transparency is non-negotiable for maintaining trust and morale on creative teams.
Monitoring Creative Teams Without Eroding Trust
Creative professionals are, justifiably, among the most skeptical audiences for workplace monitoring. Creativity requires psychological safety, autonomy, and the freedom to work in non-linear patterns. Any monitoring approach that punishes unconventional work rhythms will damage creative output more than it improves efficiency.
Marketing team productivity tracking must be designed around this reality. eMonitor supports this through several configurable features:
- Work-hours-only monitoring. Tracking starts at clock-in and stops at clock-out. No off-hours data collection, no weekend activity logging, no ambient monitoring.
- Configurable monitoring depth. For creative teams, many organizations disable screenshot capture entirely and rely on application-level time data and productivity classifications. This provides the time allocation insights managers need without creating the "watched" feeling that inhibits creative thinking.
- Employee-facing dashboards. Team members see their own activity data, creative-to-admin ratios, and weekly trends. Self-service access to personal data transforms monitoring from "something done to me" into "a tool I use to understand my own work patterns."
- Role-appropriate idle time settings. A designer staring at a screen for 8 minutes is not idle; she is thinking through a layout problem. eMonitor's configurable idle thresholds let managers set role-appropriate definitions of inactivity. Content strategists and creative directors typically require longer idle thresholds than execution-focused roles.
A 2024 Gartner survey found that organizations implementing transparent, employee-visible monitoring reported 8% higher engagement scores than those using opaque monitoring or no monitoring at all. The key is framing: monitoring as a management tool for protecting creative time, not policing it.
Real-World Scenario: How a 15-Person Marketing Team Recovered 120 Hours per Month
Consider a mid-size B2B SaaS company with a 15-person marketing department. The team included four content writers, three designers, two demand gen specialists, two social media managers, one marketing ops lead, one email marketing specialist, one video producer, and one marketing director. Campaigns were consistently launching 1-2 weeks late, and the director suspected the team was understaffed.
After deploying eMonitor, the first month of data told a different story:
- The team's average creative-to-admin ratio was 38:62, well below the 60:40 benchmark.
- Content writers spent 31% of their time in email and Slack, mostly chasing approvals and answering questions from sales.
- Designers averaged 14.2 hours per week in meetings, nearly double the recommended maximum for individual contributors.
- The team paid for 16 martech tools but actively used only 9. Three tools had zero logins in the previous 60 days.
Armed with this data, the marketing director made four changes:
- Implemented an async approval workflow in Slack, reducing content writer email time by 40%.
- Cut designer meeting attendance by 50%, replacing attendance with post-meeting summaries.
- Consolidated three overlapping tools, saving $2,100 per month in software costs.
- Set a team-wide meeting budget of 8 hours/week for ICs, enforced via eMonitor's weekly reports.
After 90 days, the team's creative-to-admin ratio improved to 57:43. Campaign on-time delivery rose from 62% to 89%. The team recovered roughly 120 hours per month of creative capacity, equivalent to hiring a full-time marketer at $75,000/year. The marketing director shelved the headcount request.
Your Marketing Team Has the Same Hidden Capacity
Join 1,000+ companies using eMonitor to find and recover productive hours. Start your free 7-day trial today.
Five Marketing Monitoring Mistakes to Avoid
Marketing team productivity tracking delivers results when implemented thoughtfully. Here are five mistakes that undermine the effort:
1. Measuring keystrokes for creative roles. Keystroke volume has zero correlation with creative output quality. A copywriter producing 200 keystrokes per minute is not necessarily more productive than one producing 60 keystrokes during a thoughtful editing pass. Use time allocation data, not input velocity, for creative teams.
2. Treating all "non-productive" app time as waste. A designer browsing Dribbble or Behance is conducting competitive research. A content writer scrolling industry subreddits is gathering audience insights. Configure eMonitor's classifications to reflect the reality of how marketing work happens, not a manufacturing-floor definition of productivity.
3. Ignoring the data after the first month. The most common failure mode is deploying monitoring, reviewing the initial report, making one or two changes, and then never looking at the data again. Schedule a monthly 30-minute review of team-level metrics. Marketing team productivity tracking is a continuous feedback loop, not a one-time audit.
4. Sharing individual data publicly. Team-level metrics belong in team meetings. Individual activity data belongs in private one-on-ones. Public individual data creates competition and anxiety that directly undermines collaborative creative work.
5. Optimizing for hours instead of output. A marketer who produces a high-converting landing page in 4 hours is more productive than one who spends 12 hours on a landing page that underperforms. Use time data as an input to capacity planning and process improvement, not as a substitute for evaluating work quality.
Frequently Asked Questions About Marketing Team Productivity Monitoring
How do you track marketing team productivity?
Marketing team productivity tracking combines time allocation data with output metrics. eMonitor records how hours split between creative work (design tools, writing apps), campaign management (ad platforms, analytics dashboards), and administrative tasks (email, meetings). Pair that time data with campaign delivery rates for a complete picture.
What metrics matter most for marketing team performance?
Marketing team performance metrics include creative-to-admin time ratio, campaign delivery on-time rate, tool utilization across the martech stack, and hours per deliverable. eMonitor tracks the time-based inputs while your CRM or analytics platform tracks revenue outputs. Together, they reveal true marketing efficiency.
Should you monitor creative teams?
Yes, but with boundaries. Creative teams benefit from monitoring that protects their deep-focus time rather than measuring keystrokes. eMonitor shows managers when designers and writers lose creative hours to meetings and admin tasks. That data helps shield creative time, not police it. Configurable monitoring levels keep the approach respectful.
How do you measure marketing team efficiency?
Marketing team efficiency is measured by comparing time invested against deliverables produced. eMonitor tracks hours per campaign, per channel, and per team member. Divide total campaign hours by output volume (ads launched, posts published, emails sent) to calculate cost-per-deliverable. Teams averaging above-benchmark ratios have capacity issues or process friction.
What is the ideal creative-to-admin ratio for marketing teams?
High-performing marketing teams maintain a 60:40 creative-to-admin ratio or better, according to Workfront's 2024 State of Work report. eMonitor identifies this ratio by classifying application usage into creative tools (Adobe CC, Figma, Canva) versus admin applications (email, Slack, spreadsheets). Teams below 50% creative time typically have process or meeting overload.
Does productivity monitoring hurt marketing team creativity?
Transparent productivity monitoring improves creativity by reducing the admin burden that erodes creative time. A 2024 Adobe Creative Pulse survey found 62% of creative professionals feel administrative tasks limit their best work. eMonitor data gives marketing leaders evidence to cut unnecessary meetings, automate reporting, and protect focus blocks for creative output.
How many hours per week should marketers spend in meetings?
Marketing professionals spend an average of 12.4 hours per week in meetings, but top-performing teams cap meeting time at 8 hours or fewer (Atlassian Workplace Research, 2024). eMonitor's activity timeline reveals exact meeting durations per team member, helping marketing directors identify and reduce meeting overload before it drains campaign capacity.
What tools should marketing teams track for productivity?
Marketing teams should track time in four tool categories: creative production (Adobe CC, Figma, Canva, WordPress), campaign management (Google Ads, Meta Business Suite, HubSpot), analytics (Google Analytics, Tableau, Looker), and communication (Slack, email, Zoom). eMonitor classifies each application automatically and generates time-spent breakdowns by category.
How do you track campaign time allocation across a marketing team?
Campaign time allocation tracking requires project-level time tagging combined with automatic activity data. eMonitor allows marketers to assign hours to specific campaigns while also capturing which applications they use. This dual approach catches time that manual tracking misses, especially quick context switches between campaigns throughout the day.
Can monitoring data improve marketing team resource planning?
eMonitor's activity data directly improves marketing resource planning. Historical time-per-campaign data shows how long each campaign type actually requires versus estimates. Marketing directors use this data to set realistic timelines, allocate headcount by channel, and identify when freelance support is more cost-effective than overtime from the existing team.
How do you identify admin overload in a marketing department?
Admin overload in marketing departments shows up as declining creative tool usage alongside rising email, meeting, and spreadsheet time. eMonitor's weekly activity reports flag this shift automatically. When a content writer's time in Google Docs drops below 40% while Slack and email climb above 35%, the data signals a workflow problem requiring intervention.
Is marketing team productivity tracking different from other departments?
Marketing productivity tracking differs because output quality matters more than output volume. A developer's code commits are countable; a brand campaign's creative impact is not. eMonitor handles this by focusing on time allocation patterns rather than output counts, measuring whether marketers spend hours on high-value creative work versus low-value admin.
Marketing Team Productivity Tracking Protects Creative Time, Not Polices It
Marketing team productivity tracking, when implemented transparently and measured through the right metrics, does not restrict creative work. It protects creative work by giving marketing leaders the data to eliminate admin overload, cut meeting bloat, rationalize tool spending, and allocate resources based on evidence rather than intuition. The 60:40 creative-to-admin ratio benchmark is achievable for any team willing to act on the data.
eMonitor provides the time allocation data, application usage analytics, and configurable productivity classifications that marketing departments need to track the metrics outlined in this guide. Teams using eMonitor see their first actionable insights within 48 hours of deployment, with most reporting measurable improvements in creative-to-admin ratio within 90 days.
The question is not whether your marketing team has hidden capacity. Based on the research, it almost certainly does. The question is whether you have the data to find it.
Find Your Marketing Team's Hidden Creative Hours
Start a free 7-day trial. Setup takes 2 minutes. Plans start at $4.50/user/month.