
Measuring Employee Monitoring Program Success: KPIs, Benchmarks & Continuous Improvement
Measuring employee monitoring program success means tracking quantifiable indicators across productivity, compliance, adoption, and financial return to determine whether your workforce visibility investment is delivering its intended outcomes. Organizations that measure monitoring program KPIs monthly are 2.4x more likely to report positive ROI than those that deploy software and never revisit the data (Forrester, 2024). This guide gives you the exact metrics, benchmarks, and continuous improvement framework to prove your program works.

Deploying employee monitoring software is the easy part. The hard part is answering the question your CFO will ask 90 days later: "Is it working?" Without a structured measurement framework, you are left with anecdotes and gut feelings, neither of which survives a budget review.
This guide covers the four KPI categories every monitoring program needs, specific benchmarks for each metric, a quarterly review cadence that prevents metric fatigue, and a continuous improvement loop that keeps your program evolving. Whether you manage 25 employees or 2,500, the measurement principles remain the same. The scale changes; the discipline does not.
Why Measuring Employee Monitoring Program Success Is Non-Negotiable
Measuring employee monitoring program success separates tools that drive value from tools that collect dust. Gartner's 2024 Workforce Analytics Market Guide found that 41% of organizations abandon monitoring software within 18 months, not because the software fails, but because no one tracks whether it produces results. The absence of measurement creates a vacuum filled by complaints, and complaints without counterbalancing data always win budget discussions.
But why do so many organizations skip measurement entirely?
Most skip measurement because they treat monitoring as a binary: installed or not installed. Employee monitoring program success requires a different mindset. The software is infrastructure. The KPIs are the operating system. Without KPIs, managers default to checking screenshots occasionally, which is neither systematic nor useful. With KPIs, managers know exactly which teams improved, which policies need adjustment, and which features drive the most value. Nucleus Research (2024) found that companies with formal measurement frameworks for workforce analytics tools achieve 3.2x higher ROI than those without them.
Measurement also protects your program from internal criticism. When an employee raises a privacy concern, you need data showing reduced overtime, improved work-life balance scores, and lower burnout indicators. When a department head argues monitoring is unnecessary for their team, you need comparative productivity data. Measurement is your program's immune system.
The Four KPI Categories for Monitoring Program Success
Employee monitoring program KPIs fall into four categories, and a healthy program tracks metrics from all four. Focusing on only one category, typically productivity, creates blind spots that eventually undermine the entire program.
Category 1: Productivity KPIs
Productivity KPIs measure whether monitoring actually changes work behavior and output quality. These are the metrics most stakeholders care about first, and they carry the highest visibility in executive reviews.
Active productive time percentage is the foundational metric. Employee monitoring software classifies each minute of work time as productive, neutral, or unproductive based on application and website categorization rules. A healthy target is 72-78% productive time within 90 days of deployment, compared to the unmonitored average of 58-65% reported by RescueTime's 2024 productivity benchmark. Track this weekly at the team level and monthly at the individual level.
Idle time percentage is the inverse signal. Idle time, defined as periods where no keyboard or mouse input is detected for a configurable threshold (typically 5 minutes), indicates disengagement, context switching, or workload imbalance. Benchmark: idle time below 12% of total work hours indicates healthy engagement. Above 18% signals a problem worth investigating. Note that some idle time is healthy, because thinking, planning, and in-person conversations do not register as computer activity. The goal is reduction from baseline, not elimination.
Focus time blocks measure deep work capacity. A focus time block is a continuous productive session of 45 minutes or more without switching to non-work applications. Knowledge workers produce their highest-value output during these blocks. Cal Newport's research on deep work suggests two to three focus blocks per day per knowledge worker is the realistic maximum. Track the average number of daily focus blocks per team and compare pre-monitoring versus post-monitoring baselines.
Output per productive hour ties activity to outcomes. This metric varies by role: tickets resolved per hour for support teams, story points completed per sprint for developers, billable hours captured per week for consultants. The metric itself depends on your business; what matters is that you connect monitoring activity data to a downstream output number. Activity without output measurement is a vanity exercise.
Category 2: Compliance and Policy KPIs
Compliance KPIs measure whether monitoring reduces policy violations and strengthens your organization's regulatory posture. These metrics matter most in regulated industries (financial services, healthcare, government) but apply to every organization managing sensitive data.
Policy violation rate tracks the number of flagged violations per employee per month. Violations include unauthorized application usage, restricted website access, after-hours work without approval, and data exfiltration attempts. A well-configured monitoring program typically reduces policy violations by 40-60% within the first quarter (Ponemon Institute, 2024). The decline is steepest in the first 30 days as employees adjust behavior knowing activity is tracked.
Data loss prevention (DLP) incident rate measures unauthorized file transfers, USB device connections, and upload violations. For organizations with DLP policies, this is a critical metric. IBM's 2024 Cost of a Data Breach report places the average breach cost at $4.88 million. Even preventing one incident justifies years of monitoring software costs. Track DLP incidents monthly and categorize by severity (informational, warning, critical).
Audit preparation time measures how quickly you can produce compliance documentation for internal or external auditors. Manual record-keeping typically requires 40-80 hours per audit cycle to compile attendance records, overtime logs, and access histories. Automated monitoring records reduce this to 4-8 hours, a 90% reduction that directly converts to labor cost savings.
Overtime compliance rate tracks whether work hours stay within labor law requirements. The U.S. Department of Labor recovered over $274 million in back wages for overtime violations in a single recent fiscal year. Automated time tracking and real-time alerts when employees approach overtime thresholds prevent violations before they occur.
Category 3: Adoption and Engagement KPIs
Adoption KPIs measure whether employees and managers actually use the monitoring system as intended. High adoption correlates directly with higher ROI; a tool that 40% of managers ignore is delivering 40% less value than it could.
Daily active user rate is the percentage of employees whose monitoring agent is active and transmitting data each workday. Target: 95%+ within 60 days of full deployment. A rate below 85% indicates technical issues (agent not installed, compatibility problems) or active resistance (employees disabling the agent). Both require different interventions.
Manager dashboard login frequency tracks how often managers review monitoring data. Deploying monitoring without manager engagement is like installing security cameras with no one watching the feeds. Benchmark: managers should log into the monitoring dashboard at least 3 times per week. Organizations where managers review data daily see 22% higher team productivity gains than those where managers check monthly (Forrester, 2024).
Employee self-service usage measures whether employees access their own productivity dashboards. When employees use self-service features, monitoring transforms from a top-down control tool to a personal productivity assistant. eMonitor provides employee-facing dashboards showing productive time, app usage, and activity trends. Target: 60%+ of employees accessing their own dashboard at least weekly within 90 days.
Feature utilization breadth tracks how many monitoring features your organization actively uses. Most organizations deploy monitoring for one reason (time tracking, screen monitoring, or productivity analytics) but the platform offers many more. Calculate the percentage of available features actively configured and reviewed. Organizations using 4+ feature modules report 2.1x higher satisfaction and 1.8x higher ROI than single-feature deployments (Gartner, 2024).
Category 4: Financial and ROI KPIs
Financial KPIs translate monitoring activity into dollar values. These are the metrics your CFO cares about, and they determine whether the program survives budget reviews.
Net monitoring ROI is the headline number. Calculate it monthly using this formula: (total recovered value minus total program cost) divided by total program cost, expressed as a percentage. Total recovered value includes productivity gains (recovered hours multiplied by loaded labor rate), overtime reduction, compliance savings, and administrative time saved. Total program cost includes software licensing, implementation labor, and ongoing management time. A healthy monitoring program delivers 300-800% ROI in year one (Nucleus Research, 2024).
Cost per monitored employee tracks your fully loaded investment per head. This includes software licensing ($4.50/user/month with eMonitor's Starter plan), IT management time allocated to the program, and any consulting or training costs. Benchmark: total cost per monitored employee should stay below $8-12 per month for mid-market organizations. If management overhead pushes your cost above $15/user, the program is over-managed and needs simplification.
Payroll error reduction rate measures the decrease in timesheet corrections, payroll disputes, and overpayment recovery actions after deploying automated time tracking. The American Payroll Association reports that businesses switching from manual to automated tracking reduce payroll errors by an average of 80% and save 2-8% of gross payroll costs annually.
Time to breakeven measures how many days after deployment the program's recovered value exceeds its cumulative cost. At $4.50 per user per month, recovering just 30 minutes of productive time daily per employee at a $25/hour loaded labor rate generates $11.25/day in recovered value. That is breakeven in under 10 business days. Track actual breakeven against this theoretical benchmark to validate your deployment is performing.
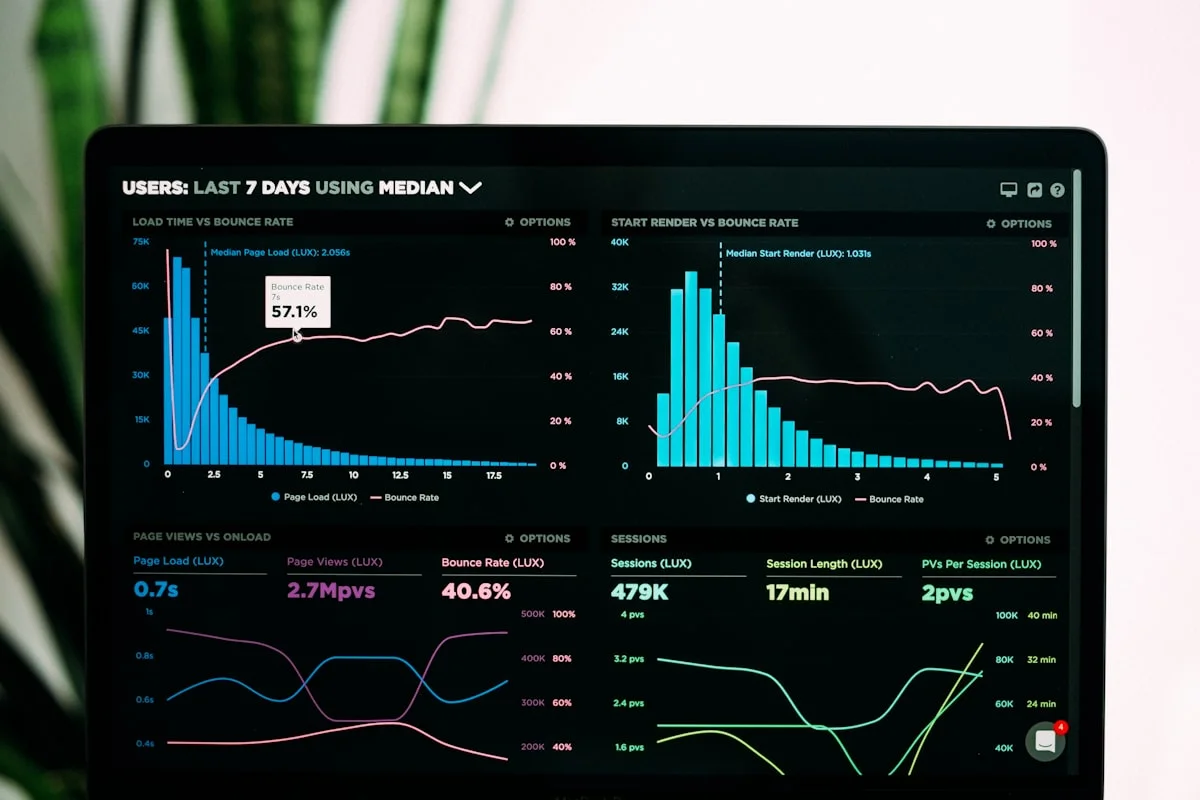
Team Productivity — This Week
Productive hours / day
Activity mix
▲ Deep-focus time up 19% after protecting daily focus blocks.
Illustrative eMonitor dashboard.
Monitoring Program Success Benchmarks by Metric
Employee monitoring program success benchmarks provide the reference points your team needs to distinguish good performance from great. The following table consolidates benchmarks from Gartner, Forrester, SHRM, and Nucleus Research into a single reference. Use the "Target by 90 Days" column for initial program goals and the "Mature Program" column for year-two optimization targets.
| KPI | Pre-Monitoring Baseline | Target by 90 Days | Mature Program (12+ Months) |
|---|---|---|---|
| Productive time % | 58-65% | 72-78% | 78-84% |
| Idle time % | 18-25% | 10-14% | 8-12% |
| Focus blocks/day | 0.8-1.2 | 1.5-2.0 | 2.0-2.5 |
| Policy violations/employee/month | 3.2-4.8 | 1.5-2.5 | 0.5-1.0 |
| Employee adoption rate | N/A | 90-95% | 97%+ |
| Manager dashboard logins/week | N/A | 3+ | 5+ (daily) |
| Employee self-service usage | N/A | 40-60% | 70%+ |
| Net ROI (annualized) | N/A | 200-400% | 500-800% |
| Payroll error rate | 5-8% | 1-2% | Below 0.5% |
| Overtime spend reduction | Baseline | 15-22% | 25-35% |
| Audit prep time (hours) | 40-80 | 8-15 | 4-8 |
These benchmarks assume a transparent deployment model where employees are informed about monitoring before it begins. Covert deployments show faster initial compliance improvements but significantly worse adoption and trust metrics at the 6-month mark (SHRM, 2024).
How to Build Your Pre-Monitoring Baseline
Building a pre-monitoring baseline is the single most important step in measuring employee monitoring program success. Without a baseline, every post-deployment number is meaningless because you have nothing to compare it against. Yet 63% of organizations skip this step entirely (Gartner, 2024).
But what exactly should the baseline capture, and how long does it take to establish?
A monitoring program baseline requires two weeks of data collection before any behavioral interventions. During this period, the monitoring agent collects data silently (with employee awareness and consent, per your monitoring policy) while managers refrain from acting on the data. The purpose is to capture natural, unmodified work patterns.
Step 1: Deploy the monitoring agent to all target employees. Communicate that data collection is beginning for baseline purposes. Explain that no individual performance actions will be taken during the baseline period. This transparency is essential for GDPR compliance (Article 13 notice requirements) and builds trust.
Step 2: Collect two full business weeks of data. Two weeks captures enough variation (different project phases, meeting-heavy versus focus-heavy days) without delaying your program. Record daily averages for productive time, idle time, application usage, login/logout times, and overtime hours.
Step 3: Calculate team-level and department-level averages. Individual baselines matter for personal growth tracking, but team-level averages are what you report to leadership. Calculate mean, median, and standard deviation for each KPI. The standard deviation tells you how much variation exists within teams, which is often more revealing than the average itself.
Step 4: Document the baseline in a formal report. This report becomes your permanent reference point. Include the date range, number of employees measured, any known anomalies (holidays, company events, system outages), and the calculated baselines for every KPI you plan to track. Store it where your CFO and HR director can access it during future reviews.
How to Calculate Monitoring Program ROI Accurately
Monitoring program ROI measurement requires honest math. Vendor ROI calculators typically inflate gains and minimize costs. Your CFO will see through that immediately, so use a conservative model that includes all cost components.

Calculating Productivity Gains
Productivity gains from monitoring are calculated by multiplying recovered productive time by the loaded labor rate. Here is a worked example for a 100-person team.
- Average loaded labor cost: $30/hour (salary plus benefits plus overhead)
- Pre-monitoring productive time: 5.2 hours/day (65% of 8 hours)
- Post-monitoring productive time (90-day): 5.8 hours/day (72.5%)
- Recovered time per employee per day: 0.6 hours
- Daily recovered value per employee: 0.6 x $30 = $18
- Monthly recovered value (22 workdays): $18 x 22 x 100 = $39,600
- Annual recovered value: $475,200
This calculation is conservative. It uses a 7.5 percentage point productivity improvement, which falls within the 5-12% range documented by Gartner's 2024 workforce analytics benchmark. It also ignores secondary gains from reduced overtime and improved project delivery, which typically add another 15-25% on top of the core productivity gain.
Calculating Total Program Cost
Total program cost includes three components that many organizations miscalculate.
Software licensing is the obvious component. eMonitor's pricing starts at $4.50/user/month (Starter plan) with Professional at $6.90/user/month and Enterprise at $13.90/user/month. For 100 users on the Professional plan: $690/month, or $8,280/year.
Implementation labor is a one-time cost most organizations overestimate. eMonitor deploys in under 2 minutes per endpoint. For 100 employees, budget 4-8 hours of IT time for deployment, policy configuration, and testing. At $50/hour loaded IT cost, that is $200-$400 total.
Ongoing management labor is the cost most organizations underestimate. Someone needs to review dashboards, generate reports, investigate exceptions, and coach managers on data interpretation. Budget 3-5 hours per week for a program covering 100 employees. At $40/hour, that is $480-$800/month, or $5,760-$9,600/year.
Total first-year cost for 100 users: $8,280 (licensing) + $400 (implementation) + $7,680 (management, midpoint) = $16,360. Against $475,200 in recovered productivity value, that is an ROI of approximately 2,800%. Even if you cut the productivity estimate in half to account for conservative assumptions, the ROI exceeds 1,300%.
The Continuous Improvement Framework for Monitoring Programs
Monitoring program continuous improvement follows a Plan-Measure-Analyze-Adjust cycle that runs quarterly. Static programs decay. Employees habituate to monitoring within 6-8 months, meaning the initial behavioral improvements plateau unless you actively refine the program. Deloitte's 2024 workforce technology study found that organizations with formal continuous improvement processes for monitoring tools retain 85% of initial productivity gains at the 24-month mark, compared to 52% for organizations without such processes.
The Quarterly Review Process
Week 1: Data collection and trend analysis. Pull all KPIs for the quarter. Compare against the previous quarter and against the original baseline. Flag any metrics that declined or plateaued. Calculate quarter-over-quarter improvement rates for each KPI.
Week 2: Root cause investigation. For any metric that declined or plateaued, investigate the cause. Common causes include: manager disengagement (stopped reviewing dashboards), policy drift (categories not updated for new applications), seasonal patterns (holiday periods, fiscal year-end pushes), and organizational changes (new hires who missed onboarding, team restructuring).
Week 3: Action planning. For each identified issue, document a specific action with an owner and deadline. Examples: "Recategorize 12 new SaaS applications added this quarter by April 15 (IT lead)," "Conduct 30-minute refresher training for 4 managers who logged in fewer than 5 times this quarter by April 22 (HR)," "Update overtime alert thresholds for the engineering team to reflect new shift pattern by April 10 (Operations)."
Week 4: Executive report and realignment. Summarize the quarter's results in a one-page executive brief: top-line ROI, notable improvements, areas of concern, and planned actions for next quarter. Present to the steering committee or executive sponsor. This cadence keeps the program visible and funded.
Six Optimization Tactics That Improve KPIs
Based on patterns observed across organizations that achieve top-quartile monitoring program ROI, these six tactics consistently move KPIs upward.
1. Refresh application categorization quarterly. Employees adopt new tools constantly. An application categorized as "uncategorized" is a gap in your productivity data. Review the top 20 uncategorized applications each quarter and assign appropriate productive, neutral, or unproductive labels. This single action typically improves productive time measurement accuracy by 3-5 percentage points.
2. Introduce team-level leaderboards (not individual). Team-level productivity comparisons create healthy competition without singling out individuals. Share anonymized team averages in monthly all-hands or department meetings. Organizations using team-level benchmarks see 12% higher improvement rates than those sharing only individual data (Gallup, 2024).
3. Train managers on coaching with data. Raw monitoring data in untrained hands becomes a micromanagement weapon. Train managers to use data for constructive coaching conversations: "I noticed your productive time dipped on Wednesdays. Are meetings overloading that day?" instead of "You were only 65% productive on Wednesday." The difference in framing determines whether monitoring builds trust or destroys it.
4. Automate exception-based alerts. Configure alerts for significant deviations rather than requiring managers to review every dashboard daily. eMonitor's alert system flags productivity drops, unusual after-hours activity, and policy violations automatically. This reduces manager review time by 40-60% while improving response time to genuine issues.
5. Expand feature utilization gradually. If you started with time tracking alone, add productivity analytics in quarter two. Add reporting dashboards in quarter three. Each additional feature compounds the program's value. Resist the temptation to activate everything on day one, as it overwhelms both employees and managers.
6. Conduct annual employee feedback surveys on the monitoring program. Ask employees: Do you find the self-service dashboard useful? Do you feel monitoring is fair? What would make it more valuable to you? Employee feedback is the canary in the coal mine for adoption issues. Organizations that survey annually have 28% lower monitoring-attributed turnover than those that do not (SHRM, 2024).

Start Measuring What Matters
eMonitor gives you the KPI dashboards, productivity analytics, and automated reporting to measure your monitoring program from day one.
Five Measurement Mistakes That Sabotage Monitoring Programs
Employee monitoring program success depends as much on avoiding measurement errors as on tracking the right KPIs. These five mistakes occur in over half of organizations we have observed.
Mistake 1: Measuring activity instead of outcomes. Screenshots captured per day, keystrokes logged per hour, and mouse movements tracked per minute are activity metrics. They tell you whether someone is physically present at a keyboard. They say nothing about whether valuable work is happening. A developer staring at a complex codebase thinking through an architecture decision registers as "idle." A support agent clicking rapidly through tickets while resolving nothing registers as "highly active." Always pair activity metrics with outcome metrics: tickets resolved, code deployed, revenue generated, projects delivered.
Mistake 2: Skipping the baseline. Without pre-deployment data, you cannot prove improvement. "Our team is 73% productive" means nothing unless you know the starting point. If the team was already 71% productive, your monitoring program added 2 percentage points. If they were 58% productive, you added 15 points. The narrative and the ROI calculation are completely different.
Mistake 3: Reviewing KPIs too frequently or too infrequently. Daily reviews create noise and anxiety. Managers who check productivity scores every morning tend to overreact to normal daily fluctuations (Mondays are always slower than Tuesdays; post-lunch productivity always dips). Weekly team-level reviews and monthly individual-level reviews balance actionability with statistical significance.
Mistake 4: Ignoring the adoption KPIs. Most organizations track productivity religiously while completely ignoring whether managers actually use the tool. A monitoring program where half the management team never logs in is delivering half its potential value. Track manager engagement as rigorously as employee productivity.
Mistake 5: Not adjusting benchmarks over time. A 72% productive time target that was ambitious in month three becomes a floor by month twelve. If you never raise the bar, improvement stalls. Recalibrate targets annually based on actual performance trends, industry benchmarks, and organizational growth goals.
Building a Monitoring Program Success Report
A monitoring program success report serves three audiences: executives who need ROI confirmation, managers who need operational guidance, and HR leaders who need compliance and culture metrics. One report format cannot serve all three. Here is how to structure reporting for each audience.
The Executive One-Pager
Executives need four numbers and a recommendation. Structure the one-pager as: (1) Net ROI for the quarter, expressed as a percentage and dollar figure. (2) Headline productivity improvement versus baseline, expressed as percentage points gained. (3) Total cost for the quarter. (4) One forward-looking recommendation (expand to a new department, add a feature module, increase manager training). Keep it under 300 words. Executives who receive concise, metric-driven updates are 3x more likely to approve program expansion than those who receive lengthy narrative reports (McKinsey, 2024).
The Manager Operations Dashboard
Managers need team-level trends with enough granularity to act. Configure weekly automated reports from eMonitor's reporting dashboards showing: team productive time trend (4-week rolling average), top 3 most-used productive applications, top 3 most-used unproductive applications, overtime hours by team member, and any triggered alerts. The key is making this information available without requiring managers to build custom reports. Pre-built dashboards increase manager engagement by 45% compared to raw data exports (Forrester, 2024).
The HR Compliance and Culture Report
HR leaders need metrics that balance productivity with employee wellbeing and legal compliance. Structure the monthly HR report as: employee adoption rate and trend, self-service dashboard usage, policy violation counts by category, overtime compliance rate, any monitoring-related grievances or help-desk tickets, and attrition risk flags. This report should also include a qualitative section noting any employee feedback received about the monitoring program during the period.
Scaling Measurement as Your Program Grows
Monitoring program measurement scales in three phases, each adding complexity as your organization matures its use of workforce data.
Phase 1 (Months 1-3): Foundation metrics. Track the four core KPIs: productive time percentage, employee adoption rate, manager engagement rate, and net ROI. This is sufficient for initial program validation and provides the data needed for the first quarterly executive report. Do not overcomplicate this phase. Four solid metrics with reliable data are better than fifteen metrics with questionable accuracy.
Phase 2 (Months 4-9): Expanded metrics. Add compliance KPIs (policy violation rate, DLP incidents, overtime compliance), advanced productivity KPIs (focus blocks, application category breakdown), and cost-specific KPIs (payroll error reduction, audit preparation time). At this stage, integrate monitoring data with other business systems. Connect productive time data to project delivery metrics from your project management tool. Connect overtime data to payroll system records. Cross-system validation strengthens confidence in your numbers.
Phase 3 (Months 10+): Predictive metrics. Mature programs add forward-looking indicators: attrition risk scores (eMonitor's attrition prediction module identifies at-risk employees 4-8 weeks before resignation), workload balance indices (identifying teams approaching burnout before productivity drops), and seasonal productivity modeling (adjusting targets based on historical patterns for Q4 pushes, summer slowdowns, etc.). These predictive metrics transform monitoring from a measurement tool into a planning tool.
See Your Team's KPIs in Real Time
eMonitor's productivity analytics dashboard tracks all four KPI categories from the first day of deployment. Trusted by 1,000+ companies and rated 4.8/5 on Capterra.
What to Do When Your Monitoring Program Underperforms
Not every monitoring program hits its targets on schedule. When KPIs plateau or decline, a structured diagnostic process identifies the root cause faster than guessing.
If productivity KPIs plateau after initial gains: Check application categorization accuracy first. Uncategorized apps dilute your productive time numbers. Then check whether managers are using data for coaching conversations. Monitoring data without managerial action produces awareness without behavior change. Gartner's research shows that monitoring combined with weekly coaching conversations produces 3x the productivity improvement of monitoring alone.
If adoption KPIs are low: Investigate separately for employees and managers. Low employee adoption usually indicates technical issues (agent crashes, compatibility problems, VPN conflicts) rather than resistance. Low manager adoption usually indicates training gaps or perceived irrelevance. The fix for employees is IT support. The fix for managers is showing them specifically how data helps them manage more effectively, with real examples from their own team's data.
If ROI is below target: Decompose the ROI calculation to find which input is underperforming. Is the productivity gain smaller than expected? Is the program costing more than budgeted? Are secondary benefits (overtime reduction, compliance savings) not materializing? Each root cause has a different fix. Low productivity gain requires deeper manager engagement. High costs require process simplification. Missing secondary benefits require expanding feature utilization beyond basic time tracking.
If employee satisfaction with the program is declining: This is the most urgent diagnostic. Declining satisfaction precedes turnover, and monitoring-attributed turnover directly reduces ROI. Survey employees immediately. Common causes include: managers using data punitively rather than constructively, privacy concerns about specific features (screen recording is more sensitive than time tracking), and lack of visible benefits to employees themselves. Address the root cause before expanding the program further.
Making Measurement a Permanent Practice
Measuring employee monitoring program success is not a one-time audit; it is an ongoing discipline that determines whether your investment compounds or decays. The organizations that achieve 500%+ ROI from monitoring share three traits: they establish baselines before deployment, they track KPIs across all four categories (not just productivity), and they run quarterly improvement cycles that keep the program evolving.
The framework in this guide is designed for practical use. Start with the four foundation KPIs in your first 90 days. Expand to the full metric set by month nine. Build the quarterly review cadence into your management calendar permanently. And revisit benchmarks annually, because a program that hit 75% productive time when the industry average was 65% is performing differently when the industry average moves to 72%.
Employee monitoring program success ultimately comes down to whether the data changes decisions. If managers use monitoring insights to coach, plan, and protect their teams, the ROI takes care of itself. If the data sits in dashboards nobody opens, the most sophisticated KPI framework in the world will not save the program.
Frequently Asked Questions
How do you measure employee monitoring success?
Employee monitoring success is measured through four KPI categories: productivity metrics (output per hour, active time percentage), compliance metrics (policy violation rates, audit pass rates), adoption metrics (daily active users, feature utilization), and financial metrics (cost savings versus software spend). Track each category monthly against a pre-deployment baseline.
What KPIs should a monitoring program track?
A monitoring program tracks productive hours per employee, idle time percentage, application usage alignment, overtime reduction rate, policy compliance score, employee adoption rate, manager report usage, and net ROI. Gartner recommends selecting 5-8 primary KPIs rather than tracking everything, and reviewing them monthly with quarterly deep-dives.
What is a good monitoring program ROI?
A good employee monitoring program ROI ranges from 300% to 800% in the first year. Nucleus Research found the median ROI for workforce analytics software is 12.6x over three years. At $4.50 per user per month, recovering just 30 minutes of productive time daily per employee generates over 500% annual return.
How do you improve monitoring program adoption?
Employee monitoring program adoption improves through transparent communication, employee self-service dashboards, manager training on data interpretation, and visible action on insights. Organizations that give employees access to their own productivity data see 34% higher adoption rates than those using monitoring in a top-down-only model (Forrester, 2024).
How long does it take to see results from employee monitoring?
Employee monitoring programs produce measurable results within 30 to 60 days. Productivity baselines stabilize in the first two weeks. Behavioral changes appear by week three as employees adjust workflows. Statistically significant productivity gains of 5-8% are visible by day 45 to 60, according to Gartner's 2024 workforce analytics benchmark.
What is a normal employee adoption rate for monitoring software?
A normal employee adoption rate for monitoring software is 85-95% within the first 90 days when deployment follows a structured communication plan. Organizations that announce monitoring transparently before deployment average 92% voluntary compliance. Those that deploy without communication average 71%, with higher help-desk ticket volume (SHRM, 2024).
How do you calculate the cost savings from employee monitoring?
Employee monitoring cost savings are calculated by summing recovered productive time (hours x loaded labor rate), reduced overtime spend, lower compliance penalty risk, and decreased administrative overhead for timesheets and attendance. Subtract total software licensing and management labor costs. Most organizations reach breakeven within one billing cycle.
What productivity benchmarks should a monitored team hit?
Monitored teams typically reach 72-78% productive time within 90 days, compared to an unmonitored average of 58-65% (RescueTime, 2024). Active time should exceed 6.5 hours in an 8-hour shift, idle time should stay below 12%, and focus time blocks of 90 minutes or more should occur at least twice daily per knowledge worker.
Should employees see their own monitoring data?
Yes. Employees who access their own monitoring data self-correct 23% faster than those without visibility (Forrester, 2024). Self-service dashboards shift monitoring from a control mechanism to a personal productivity tool. eMonitor provides employee-facing dashboards showing productive time, app usage, and activity trends for this purpose.
How often should you review monitoring program KPIs?
Monitoring program KPIs require weekly operational reviews (team-level dashboards), monthly management reviews (trend analysis and exception handling), and quarterly strategic reviews (ROI recalculation, policy adjustments, benchmark comparisons). Daily reviews create noise. Less than monthly reviews miss trends. The quarterly cadence aligns with most business planning cycles.
What is the biggest mistake companies make with monitoring metrics?
The biggest mistake is tracking activity volume instead of outcome quality. Hours logged, keystrokes counted, and screenshots captured are vanity metrics. Effective monitoring programs tie activity data to business outcomes: project delivery rates, revenue per employee, client satisfaction scores, and overtime cost reduction. Activity without outcome context drives micromanagement.
Can monitoring data predict employee turnover?
Employee monitoring data predicts turnover with moderate accuracy by detecting behavioral pattern changes. Declining productivity scores, increased idle time, reduced collaboration tool usage, and shorter work sessions often precede voluntary resignations by 4-8 weeks. eMonitor's attrition prediction module consolidates these signals into a unified risk score per employee.
Sources
- Gartner (2024). Workforce Analytics Market Guide.
- Nucleus Research (2024). ROI Benchmarks for Workforce Analytics Software.
- Forrester (2024). The State of Employee Experience Technology.
- SHRM (2024). Employee Monitoring Policy and Adoption Survey.
- RescueTime (2024). Annual Productivity Benchmark Report.
- IBM (2024). Cost of a Data Breach Report.
- Ponemon Institute (2024). Insider Threat Cost Report.
- American Payroll Association (2024). Workforce Time and Attendance Study.
- Deloitte (2024). Global Human Capital Trends: Workforce Technology.
- McKinsey (2024). The State of Organizations: Executive Decision-Making.
- Gallup (2024). State of the Global Workplace Report.
- U.S. Department of Labor (2024). Wage and Hour Division Annual Report.
Prove Your Monitoring Program Works
eMonitor gives you the dashboards, analytics, and automated reports to measure every KPI in this guide, starting from day one. 7-day free trial, no credit card required.