
What Is Digital Presenteeism? Definition, Causes, and How Monitoring Data Reveals It
Digital presenteeism is the behavior pattern in which employees maintain the visible signals of being at work online (active status indicators, frequent messaging, camera presence) while producing significantly below normal output due to disengagement, burnout, or personal distraction during work hours. First observed in traditional office research and accelerated dramatically by remote and hybrid work models, digital presenteeism is now one of the most costly and least discussed productivity problems facing knowledge-work organizations in 2026.

What Is Digital Presenteeism? The Precise Definition
Digital presenteeism is the condition in which an employee is measurably present online during working hours yet delivers output that falls materially below their established baseline. The employee appears active: their status indicator is green, they respond to messages, they join calls. But the work that requires sustained cognitive effort (deep writing, complex analysis, focused coding, strategic planning) either does not happen or happens at sharply reduced quality.
The term derives from traditional presenteeism research, which dates to Paul Hemp's 2004 Harvard Business Review analysis of employees who show up to the office while ill, injured, or emotionally exhausted. Hemp estimated that traditional presenteeism cost US employers roughly $150 billion annually in lost productivity (at a time when remote work was rare). The digital variant scales that problem into every distributed team on earth.
The critical distinction is that digital presenteeism is not the same as working slowly or having a bad week. It is a sustained pattern where presence metrics (active time, message frequency, session logs) remain normal or even elevated while output metrics (productive application usage, task completion, focus session duration) fall significantly. Monitoring data is the only reliable way to detect this gap, because managers who cannot observe their team directly have no visibility into it at all.
Digital presenteeism is also distinctly different from two behaviors it is often confused with: time theft and quiet quitting. Understanding those distinctions shapes the correct management response, which is why we address all three in this guide.
How Remote Work Accelerated Digital Presenteeism
Digital presenteeism existed before 2020 in open-plan offices, where employees who were disengaged or burned out could maintain the visual signals of productivity (typing, looking at screens, attending meetings) while accomplishing very little. Remote and hybrid work did not create the behavior; it removed the friction that previously limited it.
Three structural changes in distributed work created the conditions for digital presenteeism to become widespread.
Slack Status Anxiety
Slack status anxiety describes the pressure remote workers feel to maintain a green "active" indicator at all times, regardless of whether they are doing cognitively productive work. A 2023 Microsoft WorkLab report found that 68% of remote workers say they lack enough uninterrupted focus time, and a separate survey found that 40% of remote employees feel pressure to appear online even during personal breaks. The result is a constant toggling of activity (moving the mouse, sending low-value messages, refreshing feeds) designed to keep the status indicator green rather than to produce output.
Boundary Erosion and Burnout
Remote work dissolved the physical boundary between home and office. Employees who once left stress at the office now carry it into every room. The American Institute of Stress reported that 83% of US workers suffered from work-related stress in 2022, with remote workers reporting higher rates of boundary erosion than their in-office counterparts. Chronic stress depletes the prefrontal cortex resources required for focused, complex work. The employee clocks in on time but cannot actually engage with demanding tasks, so they fill the hours with visible-but-low-value activity instead.
Camera Surveillance Pressure
Organizations that responded to remote work by requiring cameras-on during calls, implementing webcam screenshots, or deploying intrusive monitoring tools inadvertently worsened digital presenteeism. Research published in the Journal of Applied Psychology found that camera-on mandates increased fatigue and reduced engagement, particularly among women and newer employees. Ironically, surveillance pressure designed to enforce presence produces the presenteeism behavior it is meant to prevent.
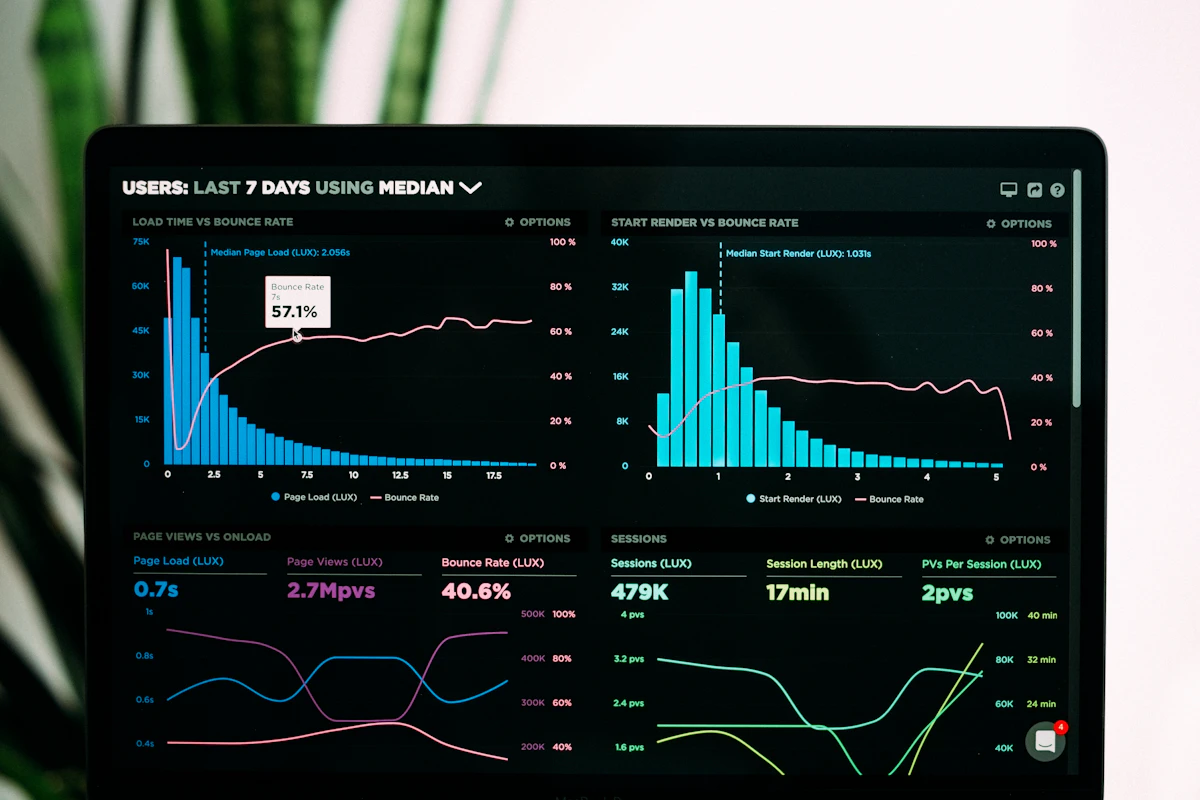
Team Productivity — This Week
Productive hours / day
Activity mix
▲ Deep-focus time up 19% after protecting daily focus blocks.
Illustrative eMonitor dashboard.
The 5 Behavioral Signatures of Digital Presenteeism in Monitoring Data
Digital presenteeism is invisible to managers who rely on presence signals alone. It becomes visible the moment you compare presence data with output data. eMonitor's productivity analytics layer tracks both dimensions simultaneously, making the following five patterns detectable without any subjective judgment from the manager.
1. High Active Time, Low Productive Application Time
Active time measures how long an employee's keyboard and mouse are in use during work hours. Productive application time measures how much of that active time was spent in applications classified as productive for that employee's role (a developer's productive apps include their IDE, code review tools, and documentation platforms; a marketer's include analytics tools, content management systems, and design software). In digital presenteeism, active time holds steady at normal levels (7-8 hours per day) while productive application usage drops to 30-50% of its prior baseline. The gap represents time spent in low-value activity designed to appear busy rather than to produce output.
2. Elevated Context Switching Rate
Context switching is the number of application or task changes an employee makes per hour. Research from Gloria Mark at UC Irvine found that the average knowledge worker switches tasks every 3 minutes and 5 seconds and takes an average of 23 minutes to regain full focus after an interruption. In digital presenteeism, context switching rates are significantly elevated because the employee cannot sustain engagement with demanding tasks. They start a document, switch to email, check Slack, browse briefly, return to the document, and abandon it again. eMonitor tracks application switches per hour; a rate more than double the employee's own 90-day baseline is a reliable early signal.
3. Very Short Average Session Duration
A focus session is a continuous period of 20 minutes or more spent in a single productive application without switching. Healthy knowledge workers average 3-5 meaningful focus sessions per day. An employee experiencing digital presenteeism rarely sustains focus sessions of more than 8-10 minutes. Their monitoring log shows a fragmented pattern: dozens of brief application touches rather than the sustained engagement that demanding work requires. eMonitor's focus time report makes this pattern immediately visible without requiring managers to interpret raw logs.
4. Unusual Messaging Pattern
Digital presenteeism often shows a paradoxical increase in messaging activity: the employee sends more Slack messages, attends more optional calls, and engages more frequently in low-stakes conversations precisely because these activities feel productive while being cognitively undemanding. Monitoring data that shows elevated communication tool time paired with depressed output-tool time is a reliable composite signal. It is the digital equivalent of an office worker who spends the day walking the floor and chatting at desks while avoiding their actual work.
5. Declining Productive Time Ratio Over Multiple Weeks
A single bad week is noise. A declining productive time ratio (PTR) across 3-5 consecutive weeks is a signal. PTR is the percentage of active working time spent in productive applications, calculated per employee relative to their own role-specific baseline. A developer whose PTR drops from 72% to 58% to 44% over four weeks is almost certainly experiencing either digital presenteeism or a significant personal or organizational problem that requires managerial attention. eMonitor tracks PTR trends automatically and flags employees whose ratio has fallen more than 15 percentage points from their 90-day baseline.

Digital Presenteeism vs Quiet Quitting vs Time Theft: A Comparison
These three behaviors produce overlapping monitoring signatures, but they have different causes and require completely different management responses. Misdiagnosing any of them leads to the wrong intervention and typically worsens the situation.
| Dimension | Digital Presenteeism | Quiet Quitting | Time Theft |
|---|---|---|---|
| Definition | Present online, output significantly below baseline | Deliberate reduction to minimum job requirements | Claiming pay for time not worked |
| Intent | Involuntary: employee cannot perform due to burnout or disengagement | Deliberate: conscious choice to reduce effort | Deliberate: conscious deception of employer |
| Primary cause | Burnout, anxiety, cognitive depletion, disengagement | Undervalued by employer, lack of growth, unfair treatment | Low motivation, financial pressure, opportunism |
| Active time in monitoring data | Normal or elevated (presence theater) | Normal to slightly reduced (exactly minimum) | Inflated (false activity to appear present) |
| Productive app usage | Significantly below baseline | Reduced but proportional to reduced effort | Very low relative to logged hours |
| Messaging pattern | Often elevated (low-stakes social activity) | Reduced (does not go above minimum) | Varies (may over-message to appear active) |
| Correct response | Coaching, workload review, mental health support | Career development conversation, recognition review | Disciplinary process, policy enforcement |
The most dangerous management mistake is treating digital presenteeism as time theft. An employee who is burned out and unable to perform does not need a disciplinary meeting; they need a workload conversation and possibly access to the company's employee assistance program. Misidentifying the behavior and responding punitively typically triggers resignation within 60-90 days, costing the employer 50-200% of that employee's annual salary in replacement costs (SHRM, 2022).
The Psychological Drivers Behind Digital Presenteeism
Digital presenteeism has multiple psychological causes that can appear individually or in combination. Understanding which driver is primary determines which intervention is most effective.
Burnout and Cognitive Depletion
Burnout is the most common driver of digital presenteeism in high-performing teams. The World Health Organization formally recognized burnout as an occupational phenomenon in ICD-11, defining it as chronic workplace stress that has not been successfully managed. Burnout manifests cognitively as an inability to sustain attention on demanding tasks, even when the employee wants to perform. The employee is present, willing, and aware that their output has declined, but cannot will themselves out of it. This produces the characteristic monitoring pattern: long active hours, minimal focused output, and elevated low-stakes activity.
Surveillance Anxiety
Surveillance anxiety is a paradoxical cause: it is induced by monitoring itself when monitoring is implemented punitively or without transparency. When employees fear that every idle moment will be flagged, reported, or used against them, they redirect energy toward appearing busy rather than doing focused work. This is why the monitoring tool's design and implementation philosophy matter as much as the data it collects. eMonitor's approach, which gives employees visibility into their own data and frames monitoring as productivity support rather than surveillance, avoids the surveillance anxiety trap that intrusive tools create.
Disengagement Without Burnout
Gallup's 2024 State of the Global Workplace report found that only 23% of global employees are actively engaged at work. Disengaged employees are not necessarily burned out: they may have adequate energy but no connection to their work's purpose, no visibility into their impact, or no trust in their management. Disengagement-driven digital presenteeism tends to show a gradual, stable-low pattern rather than the declining trend associated with burnout. The employee has settled into a minimum-visible-effort equilibrium rather than actively withdrawing.
How eMonitor's Analytics Detect Digital Presenteeism Early
eMonitor's productivity monitoring platform separates presence data from output data at the measurement level, which is the technical prerequisite for detecting digital presenteeism. Most monitoring tools report active time as a proxy for productivity. eMonitor classifies every minute of active time by the application in use and the role-specific productivity classification of that application, producing a productive time ratio that reflects actual output capacity rather than mere presence.
Focus Time Reports
eMonitor's focus time report shows the number, duration, and productive-application context of every sustained focus session per employee per day. A manager reviewing this report for a team of 12 can identify in two minutes which employees are sustaining productive focus sessions and which are showing the fragmented, short-session pattern characteristic of digital presenteeism. The report uses the employee's own 90-day history as the baseline, so it flags relative decline rather than comparing employees to each other (which would penalize roles with inherently different focus patterns).
Productive Time Ratio Trending
The productive time ratio dashboard in eMonitor plots each employee's PTR over a configurable time window (7, 30, or 90 days). A declining trend line is the clearest early warning indicator available. Managers receive automated alerts when an employee's PTR falls more than a configured threshold below their personal baseline, enabling proactive conversations before the underlying problem (burnout, disengagement, personal difficulty) escalates into resignation or termination. Early intervention at the 15% PTR-decline threshold typically recovers full employee performance within 4-8 weeks with appropriate support.
Context Switching Metrics
eMonitor tracks application switches per hour and compares each employee's current rate against their 90-day average. An elevated context switching rate paired with a depressed PTR is a composite signal that eMonitor flags automatically. This combination is specific to digital presenteeism: time theft typically shows low active time rather than fragmented active time, and quiet quitting shows reduced but proportional engagement rather than the frantic-but-unproductive pattern of presence theater.
Manager Response Guide: Addressing Digital Presenteeism Without Punishment
Digital presenteeism requires a coaching response, not a disciplinary one. The goal is to identify and remove the obstacle preventing the employee from performing, not to penalize the symptom of that obstacle. The following sequence works for most cases, with escalation steps for situations where initial coaching does not produce improvement.
Step 1: Confirm the Pattern With Data (Not Assumptions)
Before any conversation, confirm that the monitoring data shows a sustained pattern rather than a brief anomaly. A single week of low PTR may reflect a legitimate project lull, illness, or unusually heavy meeting load. Look for a 3-week or longer trend of declining PTR combined with elevated context switching and reduced focus session duration. Document the specific data points so the conversation is grounded in observable facts rather than subjective impressions.
Step 2: Open a Private, Non-Accusatory Conversation
Approach the employee privately, outside of team meetings. Frame the conversation around observations, not accusations. A productive opening: "I've noticed that your focus session time has been lower than your usual pattern over the past few weeks. I wanted to check in to understand what's been getting in the way. Is there something about the work, the team, or anything outside work that I can help address?" This opening invites honest dialogue without triggering the defensive response that accusatory framing produces.
Step 3: Listen for the Root Cause
The most important thing a manager does in this conversation is listen. The employee may disclose workload overload, an unclear priority conflict, a personal difficulty, a relationship problem with a colleague, or dissatisfaction with their role direction. Each of these has a different solution. Workload overload requires reprioritization. Unclear priorities require alignment. Personal difficulties may warrant access to the employee assistance program. Role dissatisfaction requires a career development conversation.
Step 4: Create a Recovery Plan
Where appropriate, co-create a brief recovery plan with the employee. This might involve protecting two deep-work blocks per day on their calendar, temporarily reducing meeting load, clarifying which project takes priority, or arranging access to mental health support. Document the agreed actions without making it feel like a performance improvement plan at this stage. The goal is removing obstacles, not adding accountability pressure to an already stressed employee.
Step 5: Monitor Progress and Follow Up
Use eMonitor's PTR trending data to track whether the employee's productive engagement recovers over the following 3-4 weeks. Schedule a follow-up check-in at the 2-week mark. If the PTR trend is improving, acknowledge the progress explicitly. If it is not improving after 4-6 weeks despite adequate support, a more structured performance conversation may be appropriate, with HR involvement to ensure consistency and documentation.
Digital Presenteeism Across Industries: What the Data Reveals
Digital presenteeism manifests differently across industries, shaped by the nature of the work, the monitoring tools in use, and the cultural norms around availability and output measurement.
Software Development and Technology
In software teams, digital presenteeism appears as an inflated Jira activity rate (ticket comments, status updates, meeting attendance) paired with reduced code commit frequency and lower code review depth. Developers experiencing digital presenteeism often increase their visible participation in team rituals while reducing the solitary, demanding work that generates actual output. A team lead monitoring pull request volume per developer per week alongside eMonitor's IDE application time can detect this pattern within 2-3 sprints.
Financial Services and Professional Services
In financial services, digital presenteeism is particularly costly because the work product (analysis, modeling, client communication) directly determines client outcomes and firm revenue. An analyst maintaining their email response frequency while reducing the time spent in Excel, modeling tools, or research platforms is a classic presenteeism pattern. Given that a senior analyst's productive output may represent millions of dollars in advisory value, even a 30% PTR decline for 60 days represents a significant firm risk.
Customer Support and BPO Operations
In call center and BPO environments, digital presenteeism is measurable through the contrast between logged hours and ticket resolution rates or average handling time compliance. An agent who is present and logged in but handling 40% fewer tickets per hour than their baseline is almost certainly experiencing some form of presenteeism. In high-volume support environments, this compounds quickly: across a 50-agent team, 20% digital presenteeism represents the equivalent of 10 full-time agents producing nothing while still drawing salary.
Frequently Asked Questions About Digital Presenteeism
What is digital presenteeism?
Digital presenteeism is the behavior pattern in which employees maintain the visible signals of being at work online (active status indicators, frequent messaging, camera presence) while producing significantly below normal output due to disengagement, burnout, or personal distraction during work hours. The term adapts traditional presenteeism research, which studied employees physically present at work while ill or cognitively unavailable, to the context of remote and hybrid work environments.
How does digital presenteeism differ from quiet quitting?
Digital presenteeism differs from quiet quitting in intent. Quiet quitting is a deliberate, conscious decision by an employee to reduce effort to exactly the job description minimum. Digital presenteeism is often involuntary: the employee wants to perform but cannot due to burnout, anxiety, or cognitive depletion. Monitoring data reveals this through high active-time metrics paired with low productive application usage and fragmented session patterns rather than simply reduced engagement hours.
What causes digital presenteeism in remote teams?
Digital presenteeism in remote teams is caused primarily by Slack status anxiety (fear of appearing idle), burnout from boundary erosion between work and home, surveillance anxiety from intrusive monitoring tools, and disengagement from work that lacks meaning or recognition. A 2023 Microsoft WorkLab report found that 68% of remote workers say they lack enough uninterrupted focus time, creating the conditions for presence theater rather than genuine output.
How can managers detect digital presenteeism?
Managers detect digital presenteeism by comparing presence metrics (active time, message frequency, session logs) with output metrics (productive application time, task completion, focus session duration). A consistent gap between high presence and low output is the primary indicator. eMonitor's productivity analytics surface this gap through focus time reports and productive time ratio dashboards, enabling managers to identify affected employees early without relying on subjective observation.
What monitoring data signals digital presenteeism?
The five key monitoring signals of digital presenteeism are: high logged active time paired with low productive application usage, very short work sessions with frequent context switching (under 8 minutes per session on average), elevated messaging activity during periods when no productive applications are open, normal clock-in and clock-out attendance times, and a declining productive time ratio trend over 3 or more consecutive weeks despite normal active hours.
Is digital presenteeism the same as time theft?
Digital presenteeism is not the same as time theft. Time theft is intentional: an employee consciously claims pay for time not worked. Digital presenteeism is primarily a burnout or disengagement phenomenon where the employee is technically present and not deliberately deceiving the employer. The distinction determines the correct management response. Time theft warrants disciplinary action; digital presenteeism requires a coaching and support intervention focused on removing the underlying obstacle to performance.
How does burnout cause digital presenteeism?
Burnout causes digital presenteeism by depleting the cognitive resources required for sustained productive work. A burned-out employee may clock in on time and maintain an active status indicator, but their working memory, concentration, and decision-making capacity are significantly impaired. The Maslach Burnout Inventory identifies emotional exhaustion, depersonalization, and reduced sense of accomplishment as the three dimensions of burnout, all of which manifest as presence without meaningful output in monitoring data.
What is the cost of digital presenteeism to employers?
Digital presenteeism costs US employers an estimated $150 billion annually in lost productivity, according to research published in the Journal of Occupational and Environmental Medicine. For a 100-person knowledge worker team where 20% experience significant digital presenteeism, the annual productivity loss typically ranges from $400,000 to $800,000 when accounting for salary costs at competitive knowledge-worker wage levels, missed deliverables, and downstream team impact from reduced collaboration quality.
How should managers respond to digital presenteeism?
Managers respond to digital presenteeism effectively through a coaching approach rather than a punitive one. The first step is a private, non-accusatory conversation using data observations: "I noticed your focus session time has dropped over the past three weeks. What is getting in the way?" This opens a dialogue about workload, personal stressors, or organizational blockers. Punitive responses typically worsen the underlying burnout and increase the probability of voluntary turnover within 60 to 90 days.
Can employee monitoring prevent digital presenteeism?
Employee monitoring prevents digital presenteeism when used analytically rather than punitively. eMonitor's focus time reports and productive time ratio metrics give managers early visibility into declining output trends before they escalate into full burnout or resignation. Monitoring data also helps distinguish burnout from disengagement from underperformance, enabling targeted interventions. Intrusive monitoring tools that increase surveillance anxiety can worsen digital presenteeism rather than address the underlying causes.

See What Your Team’s Workday Really Looks Like
eMonitor turns activity, time, and productivity data into clear insights — transparently, in one platform.