
Tool Fatigue: Why Employee Monitoring Actually Reduces Your Tech Stack
Your team doesn't need another app. They need fewer apps. Employee monitoring data reveals the redundancies, unused licenses, and SaaS sprawl hiding inside your tech stack, so you can consolidate instead of accumulate.
Employee monitoring tool fatigue consolidation is the process of using workforce visibility software to identify, measure, and eliminate redundant applications across an organization. Employee monitoring platforms with app and website tracking record which tools every employee actually uses, how often, and for how long. That data becomes the foundation for tech stack consolidation: cutting the applications that add complexity without adding value. For a mid-size company averaging 130 SaaS subscriptions (Productiv, 2025), the typical outcome is a 20 to 30% reduction in active tools and $50,000 or more in recovered license costs annually.
What Is Tool Fatigue and Why Does It Matter?
Tool fatigue is the cognitive and operational burden that accumulates when employees must navigate too many software applications during a typical workday. It manifests as slower task completion, higher error rates, increased frustration, and measurable productivity loss. Tool fatigue is not a vague complaint; it is a quantifiable drag on output.
But how severe is the problem, and what are its actual costs?
Cornell University's Idea Lab tracked desktop activity across 137 knowledge workers and found that the average employee toggles between applications 1,200 times per day. Each switch carries a reorientation cost of 2 to 5 seconds. At scale, those micro-interruptions consume up to 4 hours per employee per week. RingCentral's 2024 Connectivity Report found that 69% of workers spend at least 60 minutes daily just navigating between apps, and 31% lose their train of thought during app switches multiple times per hour.
The University of California, Irvine, conducted a separate study showing that recovering deep focus after a context interruption takes an average of 23 minutes and 15 seconds. While not every app switch triggers a 23-minute recovery, the cumulative effect of hundreds of daily switches is that workers spend measurably less time in sustained, productive focus states.
Tool fatigue also carries a morale cost. A 2025 Pew Research survey on workplace technology found that 54% of workers feel overwhelmed by the number of digital tools they are expected to use. That sentiment correlates with higher turnover intent: employees who report technology overload are 1.4 times more likely to actively seek a new job (Gallup, 2025).
SaaS Sprawl: The Root Cause of Tool Fatigue
SaaS sprawl is the unchecked proliferation of software subscriptions across departments, teams, and individual employees. It is the structural cause behind tool fatigue. Understanding how sprawl develops is essential to fixing it.
Why do organizations accumulate so many tools in the first place?
Three forces drive SaaS sprawl. Decentralized purchasing is the primary driver. When every department manager has a corporate credit card and the authority to buy software, there is no central check on whether a new tool duplicates existing functionality. Marketing buys one project management platform; engineering buys another; customer success adopts a third. All three tools do roughly the same thing. None of the teams knows about the other purchases.
Free-trial-to-paid conversion is the second force. SaaS vendors design their onboarding to minimize purchase friction. An employee signs up for a free trial, uses it for a week, and the trial quietly auto-converts to a paid plan billed to a team budget. Nobody reviews whether the tool adds unique value.
Merger and acquisition residue is the third. When organizations acquire other companies, they inherit entire tech stacks. Post-merger IT integration is notoriously slow; a 2024 Deloitte survey found that 62% of acquired companies still run parallel tech stacks 18 months after close. Each parallel tool set adds to the cumulative sprawl.
The result: the average company now runs 130 SaaS applications (Productiv, 2025), up from 80 in 2020. Enterprise organizations with 2,000 or more employees average 364 applications. Most employees use fewer than 10 of those tools on any given day. The gap between what organizations pay for and what employees actually use is where both financial waste and tool fatigue live.

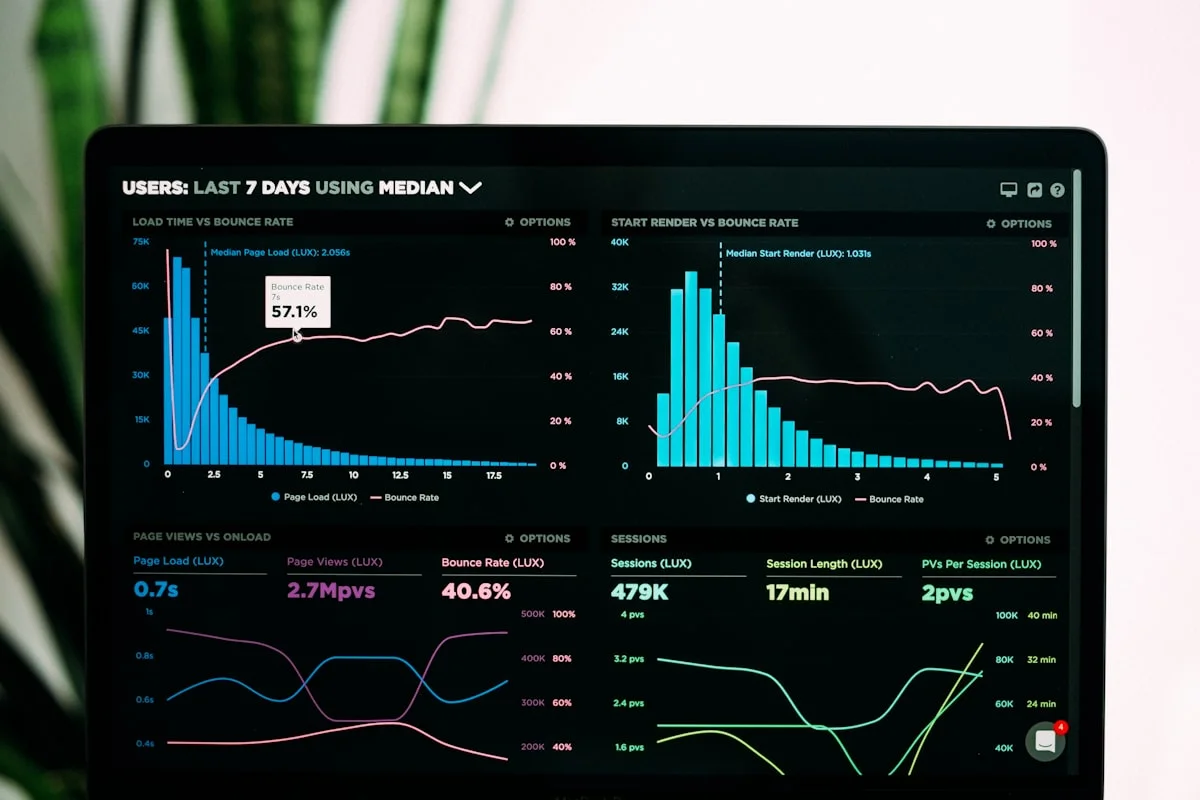
Team Productivity — This Week
Productive hours / day
Activity mix
▲ Deep-focus time up 19% after protecting daily focus blocks.
Illustrative eMonitor dashboard.
The Counter-Intuitive Case: Adding Monitoring Subtracts Tools
The objection is predictable: "We already have too many tools. Why would we add another one?" Employee monitoring software with app usage tracking is the rare addition that pays for itself in subtractions. Here is why.
How does a single monitoring platform lead to removing 20 or more other tools?
Employee monitoring platforms like eMonitor run as a lightweight background agent on each endpoint. Employees do not interact with the agent during their workday. It adds zero applications to anyone's active workflow. What it does add is visibility into every application that is already running. The monitoring agent records application names, active window time, idle time within apps, frequency of use, and which employees use which tools. That data feeds into reporting dashboards that transform app usage from an unknown into a measured quantity.
With usage data in hand, IT and operations leaders can answer questions that were previously unanswerable: Which tools does nobody use? Which tools duplicate the same function? Which teams have already organically converged on one tool while paying for three? The answers lead directly to license cancellations, consolidations, and downgrades. In practice, organizations that run their first data-driven software audit typically eliminate 20 to 30% of their SaaS subscriptions within the first quarter (Flexera, 2025).
eMonitor itself replaces multiple standalone tools. Instead of running separate apps for time tracking, productivity analytics, attendance management, and activity monitoring, one platform covers all four. That consolidation is immediate: the day you deploy eMonitor, you can sunset the point solutions it replaces.
How Employee Monitoring Data Drives Tech Stack Consolidation
Tech stack consolidation without data is guesswork. Surveys ask employees what tools they use, but self-reported data is unreliable. A 2024 Productiv study found that employees overestimate their usage of "approved" tools by 35% and underreport shadow IT usage almost entirely. Monitoring data eliminates that bias by capturing actual behavior.
What does a data-driven consolidation process look like in practice?
Phase 1: Discovery (Weeks 1 to 2). Deploy app usage tracking across all endpoints. eMonitor installs in under two minutes per machine and begins logging application data immediately. No employee interaction is needed. After two weeks, the system has enough data to produce reliable usage patterns across the entire organization.
Phase 2: Categorization (Week 3). Group applications by function: project management, messaging, video conferencing, design, development, file storage, CRM. For each category, list every tool in use and its usage metrics (unique users, average daily active time, frequency of use). This step almost always reveals surprises. Most IT leaders discover 5 to 15 applications they did not know were in use.
Phase 3: Overlap analysis (Week 3 to 4). For each functional category, compare the tools. If both Slack and Microsoft Teams are active, compare adoption rates, average daily usage time, and department-level preferences. The tool with higher organic adoption becomes the standard; the other gets marked for sunsetting. eMonitor's activity logs provide the per-user granularity needed to identify which employees need migration support.
Phase 4: Action (Week 4 onward). Cancel zero-usage licenses immediately. Downgrade low-usage seats to free or basic tiers. Migrate users from deprecated tools to the organization's standard. Negotiate renewal contracts using actual usage data rather than vendor-supplied "engagement" metrics. Track adoption of the surviving tools to confirm consolidation is sticking.
The Real Cost of Tool Fatigue (and What Consolidation Saves)
Tool fatigue imposes costs across three dimensions: direct license spend, productivity loss, and employee satisfaction. Monitoring-driven consolidation addresses all three.
How do these costs add up for a typical 200-person organization?
License waste. At $600 per employee per year in average SaaS spend (Gartner, 2025), a 200-person company pays $120,000 annually on software. With 49% underutilization (Zylo, 2025), roughly $58,800 sits idle. Conservative recovery of 25% of total spend through data-driven audits yields $30,000 in direct savings.
Productivity recovery. If context-switching between redundant tools costs each employee 4 hours per week (Cornell), and consolidation reduces switching by even 20%, that is 0.8 hours recovered per employee per week. For 200 employees at an average fully loaded cost of $50/hour, that translates to $416,000 in annualized productivity recovery. Even applying a conservative 50% discount for imperfect attribution, the figure remains significant at $208,000.
Retention value. Reducing technology frustration contributes to employee satisfaction. With the average cost to replace a knowledge worker estimated at 50 to 200% of annual salary (SHRM, 2024), preventing even two departures attributable to workplace frustration represents savings of $80,000 to $320,000 for mid-range salaries.
Against these savings, the cost of an employee monitoring platform at $4.50 per user per month ($10,800 annually for 200 users) generates a return that justifies itself within the first month.

See Every App Your Team Uses (and Doesn't Use)
eMonitor's app tracking shows per-employee, per-application usage data. Find redundant tools and idle licenses in your first week.
Shadow IT: The Invisible Layer of Tool Fatigue
Shadow IT is software that employees adopt without IT department approval. It sits outside the official tech stack, invisible to audits, unaccounted for in budgets, and fully contributing to the context-switching load employees carry daily.
How large is the shadow IT problem, and why does it accelerate tool fatigue?
Gartner estimates that shadow IT accounts for 30 to 40% of total IT spending in large organizations. A 2025 Cisco security report found that the average enterprise has 975 cloud services in use, of which only 59% are IT-approved. The remaining 41% are shadow IT: browser-based tools, Chrome extensions, freemium SaaS signups, and personal accounts repurposed for work.
Shadow IT accelerates tool fatigue because it adds tools that nobody is managing. When five people on a marketing team independently sign up for five different social media scheduling tools, the team now juggles five platforms instead of agreeing on one. Nobody coordinated the decision. Nobody evaluated overlap with existing tools. The employee's daily workflow grows more fragmented with each unauthorized addition.
Employee monitoring software detects shadow IT by logging every application and web service accessed across organizational endpoints. eMonitor's endpoint monitoring captures both installed desktop applications and browser-based SaaS tools. IT teams see the complete inventory: approved tools, unapproved tools, and the gaps between them. That visibility is the prerequisite for bringing shadow IT under control and reducing the total tool count employees must manage.

A Practical Playbook for Reducing Tool Fatigue With Monitoring Data
Theory is useful; a repeatable process is better. Here is a step-by-step playbook that IT leaders and operations managers can follow to reduce tool fatigue using employee monitoring data.
Step 1: Establish a baseline. Deploy eMonitor across all endpoints and collect 30 days of app usage data. Do not make any changes during this period. The goal is a complete, unbiased picture of your current tech stack in action.
Step 2: Map your actual tool inventory. Export the app usage report and create a master list of every application in use. For each tool, record: unique users, average daily active time, department distribution, and license cost. Compare this list against your IT-approved inventory. The delta is your shadow IT footprint.
Step 3: Identify the "big three" consolidation targets. Focus on the three functional categories with the most tool overlap. Project management, team messaging, and video conferencing are the most common offenders. For each category, rank tools by adoption (unique daily users) and engagement (average daily active time). The highest-adoption tool becomes the standard.
Step 4: Communicate the plan transparently. Share the data with team leads and explain which tools are being consolidated and why. Employees respond better to changes grounded in data ("Slack has 4x the daily adoption of Teams in our org") than to top-down mandates. eMonitor's productivity dashboards let employees see their own app usage patterns, which builds buy-in for consolidation decisions.
Step 5: Execute the migration. Cancel zero-usage licenses immediately. For tools being consolidated, set a 30-day migration window. Assign an internal champion for each surviving tool to handle questions and accelerate adoption. After migration, monitor adoption in eMonitor to confirm the old tool's usage drops to zero.
Step 6: Establish an ongoing governance process. Run quarterly software audits using fresh monitoring data. Set a policy requiring IT approval for any new SaaS subscription. Use eMonitor's alert system to flag when new, unapproved applications appear on endpoints, catching shadow IT before it takes root.
Tool Fatigue Consolidation and Employee Experience
Reducing the number of active tools is not just an IT cost exercise. It directly improves day-to-day work experience. Fewer tools mean fewer logins, fewer notification streams, fewer "which app was that conversation in?" moments, and more time in the applications that actually advance the work.
Does consolidation carry risks for employee experience, and how do you mitigate them?
The primary risk is removing a tool that a small but vocal group depends on. Monitoring data mitigates this risk precisely because it shows usage at the individual level. Before sunsetting any application, check per-user data in eMonitor. If 3 out of 200 employees use a tool heavily while 197 never touch it, the conversation changes: migrate those three users to the standard tool with dedicated support, rather than maintaining a $15,000/year license for a 1.5% adoption rate.
There is also an emotional component. Employees sometimes resist consolidation because they feel ownership over "their" tool. Transparency helps: when employees see in their own productivity dashboard that they spend 80% of their project management time in Asana and 4% in Monday.com, the case for dropping Monday.com becomes self-evident.
Organizations that have completed monitoring-driven consolidation report higher employee satisfaction with technology (Forrester, 2025). Fewer tools mean less cognitive load, fewer passwords to manage, faster onboarding for new hires, and a more coherent digital work environment. A 2025 Asana Work Index found that employees working in organizations with a rationalized tech stack report 28% higher job satisfaction compared to those in organizations with unmanaged SaaS sprawl.
How eMonitor Replaces Multiple Point Solutions
Employee monitoring platforms that combine multiple workforce visibility functions in a single agent create an immediate, concrete reduction in tool count. eMonitor is a clear example of this consolidation-by-design approach.
Which standalone tools does a comprehensive monitoring platform replace?
Time tracking software. Standalone time trackers (Toggl, Harvest, Clockify) require employees to manually start and stop timers or fill out timesheets. eMonitor's automatic time tracking captures work hours in the background. One tool eliminated.
Attendance management software. Dedicated attendance platforms track clock-ins, absences, and shift compliance. eMonitor's attendance tracking module handles all of this within the same agent. Second tool eliminated.
Productivity analytics platforms. Standalone productivity tools like ActivTrak or Insightful measure app usage and productivity scores. eMonitor includes productivity analytics with the same depth: app classification, productivity scoring, heatmaps, and team comparisons. Third tool eliminated.
Basic project time allocation tools. Tools dedicated to tracking billable hours by project or client can be replaced by eMonitor's task-level time tracking and project time allocation features. Fourth tool eliminated.
For a team currently running four separate point solutions at an average of $5 to $10 per user per tool, consolidating to eMonitor at $4.50 per user per month reduces both cost and tool count. More importantly, it reduces the number of dashboards, logins, and data silos that managers and employees must navigate daily.
Frequently Asked Questions About Tool Fatigue and Monitoring
How does monitoring reduce tool fatigue?
Employee monitoring software with app usage tracking records which applications each person actually opens and how long they use them. eMonitor surfaces zero-usage and low-usage tools across the organization. Teams use that data to eliminate redundant apps, consolidate overlapping platforms, and reduce the daily tool-switching that causes fatigue.
Can monitoring identify unused software licenses?
eMonitor's app and website tracking logs every application opened on every endpoint. Reports flag licenses with zero activity over 30, 60, or 90 days. IT teams use these reports to cancel idle seats, downgrade underused accounts, and reassign licenses to employees who actually need them.
What is SaaS sprawl?
SaaS sprawl is the uncontrolled accumulation of software subscriptions across an organization. The average company runs 130 SaaS applications (Productiv, 2025), but most employees use fewer than 10 daily. Sprawl inflates costs, fragments workflows, and forces employees to context-switch between too many platforms.
How to audit tech stack with monitoring data?
Deploy app usage tracking across all endpoints to capture application-level data automatically. eMonitor generates per-user and per-application usage reports. Compare active usage against your license inventory to flag tools for removal, downgrade, or consolidation. Run this audit quarterly for best results.
What is tool fatigue in the workplace?
Tool fatigue is the cognitive overload employees experience from switching between too many software applications during a workday. Cornell University research found the average worker toggles between apps 1,200 times per day. Each switch costs 2 to 5 seconds of reorientation, totaling up to 4 hours of lost focus weekly.
How many apps does the average employee use?
The average employee uses 9 to 11 applications daily, according to RingCentral's 2024 Connectivity Report. However, the average organization pays for 130 or more SaaS subscriptions (Productiv, 2025). The gap between purchased tools and used tools represents both financial waste and a source of context-switching fatigue.
Does adding monitoring software make tool fatigue worse?
eMonitor runs as a lightweight background agent with no daily interaction required from employees. It adds zero apps to an employee's active workflow. The data it collects, though, typically leads to removing 20 to 30% of redundant tools, resulting in a net reduction in the number of platforms employees juggle.
What is the cost of context switching between tools?
A University of California, Irvine study found it takes an average of 23 minutes to regain deep focus after a context switch. When employees toggle between apps 1,200 times daily (Cornell), the cumulative productivity loss equals roughly 4 hours per employee per week, or 9% of annual working hours.
How do you consolidate a bloated tech stack?
Start with usage data, not opinions. eMonitor's app tracking reveals actual time spent in each tool per employee, team, and department. Identify duplicate-function tools (two project management apps, three messaging platforms). Pick the tool with highest adoption, migrate the remaining users, and cancel the rest.
Can monitoring data help negotiate software contracts?
Actual usage data gives procurement teams hard evidence during vendor renewals. When reports show only 40 of 100 purchased seats are active, you negotiate from facts rather than estimates. Companies using usage data in negotiations report 15 to 20% lower renewal costs (Gartner, 2025).
What role does shadow IT play in tool fatigue?
Shadow IT, the unauthorized apps employees adopt on their own, adds tools to the stack that IT never approved or budgeted for. Gartner estimates shadow IT accounts for 30 to 40% of total IT spending. Monitoring surfaces these hidden apps so IT can consolidate them into approved alternatives or negotiate enterprise licenses.
How often should companies audit their software stack?
Quarterly audits catch waste before renewal cycles lock in another year of unused seats. Monthly reviews work best for fast-growing teams adding headcount rapidly. Continuous monitoring through app tracking tools like eMonitor provides real-time data, making quarterly formal reviews straightforward instead of a manual scramble.
Employee Monitoring as a Tech Stack Consolidation Tool
The paradox at the center of this article is real: adding one tool (employee monitoring) reduces the total number of tools an organization runs. The mechanism is straightforward. Employee monitoring tool fatigue consolidation works because app usage data replaces assumptions with evidence. Evidence drives action: canceling idle licenses, merging duplicate platforms, sunsetting shadow IT, and standardizing on the tools that employees have already chosen through organic adoption.
The financial return is clear. The productivity return from reduced context switching is significant. The employee experience improvement from working in a simpler, more coherent digital environment is measurable. And the ongoing governance process, quarterly audits powered by continuous monitoring data, ensures the benefits compound over time rather than reverting to sprawl.
For organizations drowning in SaaS sprawl and hearing daily complaints about tool fatigue, the solution is not to stop buying software. The solution is to gain visibility into what you already own. That visibility starts with monitoring data.