
The Productivity Visibility Gap: What Happens When Leaders Cannot See How Work Gets Done
The productivity visibility gap is the measurable disconnect between employee self-reported productivity and what leaders can actually verify about work output and effort. Microsoft's 2022 Work Trend Index found that 87% of employees say they are productive at work, while only 12% of leaders have full confidence their teams are productive. That 75-point perception gap drives billions in misallocated resources, broken trust, and management decisions based on intuition instead of evidence.
The productivity visibility gap is not a new problem, but remote and hybrid work have made it impossible to ignore. When everyone sat in the same office, leaders relied on physical presence as a proxy for productivity. Walking the floor, watching screens, and counting occupied desks provided a (deeply flawed) sense of what teams were doing. That proxy vanished in 2020, and most organizations have found nothing to replace it.
The result is what Microsoft CEO Satya Nadella called "productivity paranoia": leaders worrying that employees are not working, while employees feel they have never worked harder. Neither side is lying. Both are operating without shared data. This article examines what drives the productivity visibility gap, what it costs when left unaddressed, and how workforce analytics gives both leaders and employees a shared, evidence-based picture of how work actually gets done.
What Drives the Productivity Visibility Gap
The productivity visibility gap exists because leaders and employees define, measure, and experience productivity through fundamentally different lenses. Employees track inputs: hours worked, tasks completed, emails sent, meetings attended. Leaders track outcomes: revenue generated, projects delivered on time, client satisfaction, and quarterly targets. Neither perspective is wrong. The gap forms because no shared measurement system connects the two.
How does a disconnected measurement system create real organizational damage? Three structural factors explain why the productivity visibility gap persists even in well-managed organizations.
The Proximity Bias Problem
Proximity bias is the unconscious tendency to evaluate employees who are physically visible more favorably than remote colleagues doing equivalent (or better) work. A 2023 study by the Society for Human Resource Management found that 67% of managers admit remote workers are easier to replace and are more likely to be passed over for promotions (SHRM, "Manager Perceptions of Remote Workers," 2023). The productivity visibility gap widens when physical presence substitutes for actual performance data.
In hybrid environments, this creates a two-tier workforce. Employees who come to the office appear more productive because their work is visible. Remote employees, doing the same tasks at the same speed, become invisible. Without workforce analytics that measure output regardless of location, leaders default to what they can see: occupied desks and busy hallways.
Confusing Activity With Outcome
Employees and leaders disagree about productivity because organizations rarely define what productivity means for a given role. Is a software developer productive if they write 500 lines of code, or if they ship a stable feature? Is a support agent productive if they close 40 tickets, or if customer satisfaction scores stay above 90%? Without explicit definitions, employees measure effort while leaders measure impact, and the gap between those perspectives grows.
Harvard Business Review found that only 14% of organizations have a formal, agreed-upon definition of productivity at the role level (HBR, "The Real Productivity Crisis," January 2024). The remaining 86% rely on informal expectations, manager judgment, and anecdotal evidence. The productivity visibility gap is fundamentally a measurement gap.
Digital Dark Matter: Work That Leaders Cannot See
A significant portion of modern knowledge work is invisible to leadership. Asana's 2024 Anatomy of Work Index reports that 58% of an employee's day is spent on "work about work": searching for information, switching between tools, responding to messages, updating project boards, and attending status meetings (Asana, "Anatomy of Work Index," 2024). This work is real, necessary, and exhausting, but it produces no visible output.
Leaders looking at completed deliverables see only the 42% of work that creates tangible artifacts. The other 58% is digital dark matter: effort that is essential to organizational function but produces no easily measurable output. Employees know they spent the day working hard. Leaders see a thin stream of visible output and question what happened to the rest of the day. The productivity visibility gap is, in large part, a gap in understanding where time actually goes.

The Financial Cost of the Productivity Visibility Gap
The productivity visibility gap is not an abstract leadership challenge. It has a measurable dollar cost that compounds across every team, quarter, and fiscal year. Organizations that cannot see how work gets done make predictable, expensive mistakes.
But what exactly does workforce blindness cost? The financial impact falls into five categories, each with its own compounding effect.
Undetected Disengagement
Gallup's 2024 State of the Global Workplace report found that only 23% of employees worldwide are engaged at work. The remaining 77% are either "not engaged" (doing the minimum) or "actively disengaged" (working against organizational goals). Actively disengaged employees alone cost the US economy an estimated $1.9 trillion in lost productivity annually (Gallup, 2024).
Without workforce visibility, disengagement goes undetected for months. A team member gradually reducing output, spending more time in non-work applications, or increasing idle periods sends clear behavioral signals. But if no system captures those signals, the performance decline only becomes visible when a deadline is missed or a project fails. By that point, intervention is reactive and often too late. eMonitor's productivity analytics detect engagement drops within days, not months, by tracking changes in activity patterns, focus time, and application usage trends.
Workload Misallocation
When leaders lack visibility into how individuals spend their time, workload distribution becomes guesswork. High performers absorb more and more work because they deliver results; their managers have no data showing the employee is already at 110% capacity. Meanwhile, underperformers coast with light workloads because nobody has evidence of the imbalance.
The result is predictable. A 2023 Deloitte study found that 77% of workers have experienced burnout at their current job, with workload imbalance cited as the primary driver (Deloitte, "Workplace Burnout Survey," 2023). The top performers burn out and leave. The organization loses its best people not because of compensation or culture, but because leadership could not see the workload distribution that pushed them out.
Workforce analytics tools like eMonitor's time tracking and activity monitoring reveal exactly how hours are allocated across individuals, teams, and projects. When a manager can see that one developer logs 9.5 hours daily in development tools while another averages 5.2 hours, the workload rebalancing conversation starts from evidence, not accusation.
Delayed Performance Intervention
Without real-time visibility, performance problems are identified through lagging indicators: missed deadlines, client complaints, failed audits, and quarterly reviews that reveal issues weeks or months after they began. The delay between problem onset and management intervention is the most expensive element of the productivity visibility gap.
McKinsey estimates that early intervention on performance issues reduces the total cost of underperformance by 40 to 60% compared to reactive responses (McKinsey, "The State of Organizations 2023"). A team member struggling with a new tool, a process bottleneck that adds 30 minutes to every task, or a workflow dependency that keeps three people waiting for one person's output are all detectable within days using activity data. Without that data, these issues fester for weeks.
The Cost of Misguided Return-to-Office Mandates
The productivity visibility gap is the primary driver of return-to-office (RTO) mandates. When leaders cannot see how work gets done remotely, the instinct is to bring everyone back to the office where work is visible. But research consistently shows that RTO mandates do not improve productivity and often damage it.
A 2024 study published in the Pittsburgh Business Review analyzed S&P 500 firms implementing RTO mandates and found no statistically significant improvement in financial performance or employee productivity (Yuye Ding and Mark Ma, "Return-to-Office Mandates," University of Pittsburgh, 2024). What the mandates did produce: a measurable decline in employee satisfaction and a spike in voluntary attrition among high performers. The organizations that issued RTO mandates were not responding to productivity data. They were responding to the productivity visibility gap: the inability to verify remote productivity without physical presence.
Organizations with workforce analytics do not need RTO mandates to feel confident in remote team performance. When managers see real-time productivity data, time allocation breakdowns, and output metrics for every employee regardless of location, the anxiety that drives RTO decisions dissipates. The data replaces the need for physical observation.
Eroded Trust and Its Hidden Price
The productivity visibility gap erodes trust in both directions. Leaders distrust employees because they cannot verify work. Employees distrust leaders because constant check-ins, micromanagement, and RTO mandates signal that their managers believe they are not working. This mutual distrust is expensive.
Harvard Business Review reports that employees at high-trust organizations experience 74% less stress, show 106% more energy at work, and take 13% fewer sick days than employees at low-trust organizations (Paul J. Zak, "The Neuroscience of Trust," HBR, 2017). Trust is not a soft metric. It directly affects absenteeism, discretionary effort, and healthcare costs. The productivity visibility gap, left unaddressed, degrades trust systematically.
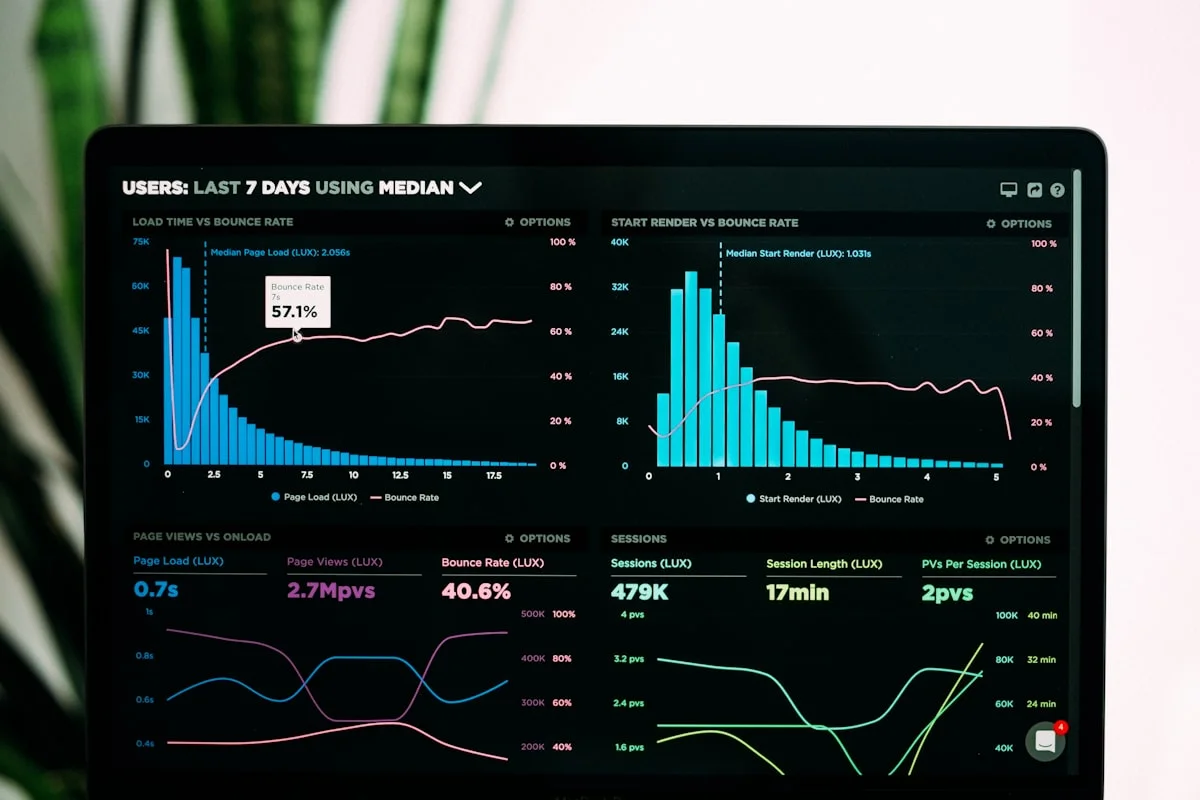
Team Productivity — This Week
Productive hours / day
Activity mix
▲ Deep-focus time up 19% after protecting daily focus blocks.
Illustrative eMonitor dashboard.
Productivity Paranoia: The Leadership Response That Makes Things Worse
Productivity paranoia is the term Microsoft coined to describe leaders' persistent anxiety that employees are not working as hard as they claim. The 2022 Work Trend Index data reveals the scale of the problem: 85% of leaders say the shift to hybrid work has made it difficult to have confidence that employees are being productive (Microsoft, 2022).
But how does productivity paranoia actually manifest in management behavior? It surfaces in three predictable patterns that worsen the very problem they intend to solve.
Over-Monitoring Without Context
Some leaders respond to the visibility gap by implementing aggressive monitoring without explaining the purpose or sharing the data with employees. Keystroke counting, minute-by-minute screenshots, and mandatory webcam-on policies create the appearance of oversight without providing genuine productivity insight. Employees respond predictably: they optimize for the monitored metric (mouse movements, time-in-app) rather than actual output. This is Goodhart's Law in action: when a measure becomes a target, it ceases to be a good measure.
Effective workforce visibility requires monitoring that measures what matters, activity patterns, focus time, productive application usage, and time allocation, and then shares that data transparently. eMonitor's app and website tracking classifies applications by productivity category, so the metric is "time in productive tools" rather than "mouse movements detected." The distinction is critical.
Meeting Inflation as a Proxy for Visibility
When leaders lack data on work progress, they schedule more meetings. Status updates, check-ins, stand-ups, one-on-ones, and all-hands meetings multiply. Microsoft's research found that weekly meeting time for the average employee increased 153% since the start of the pandemic (Microsoft, "Work Trend Index Annual Report," 2023). Each meeting consumes time, fragments focus, and produces exactly zero deliverable output.
The irony is that meeting inflation worsens the productivity visibility gap. Every hour in a status update is an hour not spent on productive work. Employees fall further behind on actual tasks, leadership sees even less visible output, and the cycle continues. Workforce analytics that track time allocation can show exactly how many hours per week a team spends in meetings versus focused work, giving leaders the data to cut unproductive meetings instead of adding more.
Micromanagement and the Trust Spiral
The final manifestation of productivity paranoia is escalating micromanagement. Frequent progress requests, mandatory daily reports, tight deadlines on trivial tasks, and constant Slack pings for updates. A 2023 study by Trinity Solutions found that 69% of employees who experienced micromanagement considered changing jobs, and 36% actually left (Trinity Solutions, "Micromanagement Survey," 2023).
Micromanagement is the most expensive response to the productivity visibility gap because it drives away the employees leaders can least afford to lose. High performers, who value autonomy and have the most job market options, leave first. What remains is a team of employees who tolerate tight oversight, which often correlates with lower initiative and lower performance. The visibility gap narrows, but only because the top of the performance curve walked out the door.


Replace Paranoia With Data
eMonitor gives leaders and employees a shared, transparent view of how work happens. No guesswork. No micromanagement. Just evidence.
Why Traditional Management Approaches Fail to Close the Productivity Visibility Gap
Before exploring solutions, it is worth examining why the standard management toolkit fails to address the productivity visibility gap. Most organizations have tried multiple approaches, and most have produced more friction than clarity.
Self-Reported Time Tracking
Asking employees to log their own time introduces the very bias the process is meant to eliminate. The American Psychological Association has documented that humans are poor estimators of their own time allocation, typically overestimating productive time by 25 to 40% (APA, "Time Perception and Self-Report Accuracy," 2021). Self-reported timesheets also carry significant compliance risk: the American Payroll Association estimates that inaccurate timesheets cost US employers $50 billion annually.
Self-reporting does not close the productivity visibility gap. It adds a layer of subjective data that both leaders and employees distrust for different reasons.
OKRs and KPIs Without Activity Data
Objective and Key Result frameworks measure outcomes, not the process that produces them. A team might hit every KPI while working 60-hour weeks in an unsustainable pattern. Another team might miss targets because a single bottleneck in their workflow costs them 8 hours per week. OKRs reveal what happened, but not why or how.
KPIs and OKRs are essential management tools, but they are lagging indicators. The productivity visibility gap exists in the space between leading indicators (daily activity, time allocation, focus patterns) and lagging indicators (quarterly output, revenue, project completion). Organizations need both. Most have only the latter.
Project Management Tools Alone
Jira boards, Asana timelines, and Monday.com dashboards track task status, but they do not track how time is spent between task status changes. A task that moves from "In Progress" to "Complete" reveals nothing about whether the employee spent 3 focused hours or 8 fragmented hours switching between the task, email, Slack, and social media. Project management tools are excellent at answering "what got done" and completely silent on "how did it get done."
The productivity visibility gap lives in the "how." Workforce analytics fills exactly this space by providing the activity-level data that project management tools were never designed to capture.
How Workforce Analytics Closes the Productivity Visibility Gap
Workforce analytics is the practice of collecting, measuring, and analyzing employee activity data to understand how work happens across teams and individuals. When implemented transparently, workforce analytics closes the productivity visibility gap by giving leaders and employees the same data set. Shared visibility eliminates the perception mismatch that drives productivity paranoia.
But how does workforce analytics move from concept to measurable impact? Four capabilities drive the shift from guesswork to evidence-based management.
Objective Activity Measurement
The foundation of workforce visibility is automated, objective data collection. eMonitor's employee monitoring platform captures application usage, website activity, active and idle time, and task progress automatically during configured work hours. The data is not self-reported, manually entered, or estimated. It is captured in real time from actual computer activity.
Objective measurement eliminates the "he said, she said" dynamic that characterizes the productivity visibility gap. When a manager can see that a team averages 6.2 hours of active productive time per 8-hour workday, with 1.1 hours in meetings and 0.7 hours idle, the conversation shifts from "Are you being productive?" to "How can we protect more of your focus time?" That shift transforms the manager-employee relationship.
Role-Based Productivity Classification
Raw activity data is meaningless without context. A developer spending 3 hours on Stack Overflow is researching solutions. A salesperson spending 3 hours on Stack Overflow is almost certainly not doing their job. eMonitor's productivity classification engine allows managers to define what "productive" means for each role, team, or department. Applications and websites are categorized as productive, non-productive, or neutral based on job function.
Role-based classification closes the productivity visibility gap at the definition level. When leaders and employees agree on what counts as productive work for a specific role, the 87% vs. 12% perception gap collapses. Both sides look at the same classification rules and the same data.
Early Warning Through Pattern Detection
The highest-value application of workforce analytics is not catching underperformance, it is detecting changes before they become problems. eMonitor's alert system establishes behavioral baselines for each employee and flags deviations: increasing idle time, shifting from productive to non-productive applications, declining focus time, or unusual working hours.
These signals serve as an early warning system. When a previously engaged employee's productive time drops by 15% over two weeks, the alert prompts a conversation, not a punishment. Maybe the employee is stuck on a technical problem. Maybe they are dealing with a personal issue. Maybe their workload was quietly reassigned without their input. The point is that the conversation happens in week two, not month six.
Employee-Facing Dashboards for Shared Visibility
The critical distinction between workforce visibility and employee surveillance is who sees the data. Surveillance is one-directional: managers watch employees. Visibility is bidirectional: everyone sees the same information. eMonitor provides employee-facing dashboards where individuals view their own productivity scores, time allocation breakdowns, and activity trends.
When employees see their own data, two things happen. First, self-awareness drives self-correction. An employee who sees that they spent 2.3 hours in email yesterday and only 3.1 hours in their core work tools does not need a manager to tell them to adjust. Second, trust increases because the monitoring is transparent. Employees know exactly what is measured, how it is classified, and what their managers see. Organizations using eMonitor report that employee-facing dashboards are consistently the highest-rated feature in satisfaction surveys.
A Framework for Measuring the Productivity Visibility Gap in Your Organization
How do you know if your organization has a productivity visibility gap, and how severe is it? Five diagnostic questions reveal the answer.
Five Diagnostic Questions
- Can you quantify how your team spends their average workday? If the answer relies on estimates, self-reports, or anecdotes, you have a visibility gap. eMonitor's reporting dashboards provide hour-by-hour breakdowns of time allocation for every team member.
- Do you know which employees are at burnout risk right now? Burnout is a leading indicator of attrition. If identifying burnout risk requires waiting for the employee to say something, the visibility gap is costing you retention. eMonitor's activity data shows sustained overtime, declining idle time, and increasing weekend work.
- When was the last time you discovered a performance issue more than 30 days after it started? If performance problems routinely surface at quarterly reviews or through client complaints, the gap between activity data and management awareness is at least 30 days wide.
- Do your remote employees receive the same recognition and promotion rates as in-office employees? If not, proximity bias is substituting for productivity data. The visibility gap is creating an inequitable workplace.
- How many hours per week does your team spend in status update meetings? High meeting loads typically correlate with low workforce visibility. Leaders schedule more meetings when they lack data. eMonitor's attendance and time tracking data reduces the need for status meetings by providing the information those meetings are trying to extract.
Assessing Gap Severity
| Indicator | Low Gap | Moderate Gap | Severe Gap |
|---|---|---|---|
| Performance issue detection time | Within 1 week | 2 to 4 weeks | Discovered at quarterly review |
| Time allocation data source | Automated tracking | Self-reported timesheets | No tracking at all |
| Manager confidence in remote productivity | High, data-backed | Moderate, assumption-based | Low, anxiety-driven |
| Weekly status meetings per team | 1 or fewer | 2 to 3 | 4 or more |
| Workload distribution method | Capacity data + activity data | Manager intuition | First available or loudest voice |
| Burnout detection | Automated alerts from activity trends | Manager observation | Employee resignation letter |
Organizations scoring "Severe" on three or more indicators are experiencing the full financial impact of the productivity visibility gap. The costs outlined earlier in this article (disengagement, misallocation, delayed intervention, trust erosion) are actively compounding.
Closing the Productivity Visibility Gap: A Practical Implementation Path
Closing the productivity visibility gap requires more than buying software. It requires a deliberate shift in how organizations think about visibility, measurement, and the relationship between managers and employees. Here is a practical four-phase approach.
Phase 1: Define Productivity at the Role Level (Week 1)
Before any technology deployment, leaders and teams must agree on what productive work looks like for each role. A customer support agent's productive tools are different from a developer's. A designer's productive pattern looks nothing like an accountant's. Write explicit definitions: "For this role, productive work includes these applications, these tasks, and these outputs."
This exercise alone surfaces hidden assumptions. Teams that complete this step frequently discover that managers and employees had different mental models of the role all along, a mini visibility gap within the larger organizational gap.
Phase 2: Deploy Transparent Workforce Analytics (Weeks 2 to 3)
Deploy eMonitor with full transparency. Announce the deployment, explain what data is collected, show employees their dashboards on day one, and document the productivity classifications for each role. Transparency is non-negotiable. Covert monitoring closes the data gap but widens the trust gap, making the overall problem worse.
eMonitor's deployment process takes under 2 minutes per device. The lightweight desktop agent captures activity data during configured work hours only. No off-hours tracking, no personal device monitoring, no content capture. The first week of data establishes individual and team baselines.
Phase 3: Establish Baselines and Identify Patterns (Weeks 3 to 6)
The first 30 days of workforce data reveal patterns that were previously invisible. Common discoveries include: one team spending 35% of their time in meetings (far above the organization average), a top performer consistently working 10+ hours, a workload imbalance where two people carry 60% of a six-person team's output, and a process bottleneck that adds 45 minutes to every task in a specific workflow.
These patterns are not judgments. They are data points that enable targeted conversations. The manager who discovers a 10-hour-per-day pattern can have a supportive conversation about workload before that employee burns out and resigns.
Phase 4: Integrate Visibility Into Management Rhythms (Ongoing)
Workforce analytics data should inform, not replace, existing management practices. Replace one weekly status meeting with a 10-minute dashboard review. Use time allocation data in one-on-ones instead of asking "What did you work on this week?" Reference productivity trends in quarterly reviews instead of relying on recency bias and subjective impressions.
Over time, the productivity visibility gap narrows because leaders make decisions from data, employees feel their work is fairly measured, and the mutual distrust that characterizes productivity paranoia gives way to evidence-based collaboration. Organizations using workforce analytics report that manager-employee trust scores improve by 20 to 35% within 90 days when implementation follows a transparency-first approach (Gartner, "Digital Workplace Survey," 2024).

Real-World Impact: What Visibility Changes
Closing the productivity visibility gap produces measurable, compounding returns across retention, efficiency, and trust. The data is consistent across organization sizes and industries.
A 200-person IT services company deployed eMonitor and discovered that 23% of weekly working hours were consumed by internal meetings, documentation updates, and status reporting. By reducing meeting frequency and replacing status updates with dashboard reviews, the team recovered 9.2 productive hours per person per month. Over a year, that recovery represented approximately $1.4 million in recaptured productive capacity.
A 75-person BPO operation used workforce analytics to identify workload imbalances across shifts. Activity data showed that the morning shift consistently handled 40% more volume than the afternoon shift, while staffing was equal. Rebalancing shifts based on actual demand patterns improved agent utilization by 18% without adding headcount. The same data revealed that two team leads were handling escalations that consumed 3 hours per day each, a process bottleneck that had been invisible for over a year.
These organizations did not need more meetings, more check-ins, or more reporting requirements. They needed visibility into how work was already happening. The data existed in their employees' daily activity. It just was not being captured or analyzed.
Visibility Without Surveillance: Getting the Balance Right
The most common objection to workforce analytics is the fear that closing the productivity visibility gap requires invasive monitoring. That objection conflates visibility with surveillance. They are not the same thing.
Surveillance is covert, one-directional, and punitive. It monitors everything, shares nothing with employees, and uses data primarily to catch wrongdoing. Visibility is transparent, bidirectional, and constructive. It measures agreed-upon productivity indicators, shares data with employees through their own dashboards, and uses insights to improve processes, balance workloads, and support struggling team members.
eMonitor is designed for visibility, not surveillance. Key privacy-preserving features include: monitoring only during configured work hours, employee-facing dashboards with full access to personal data, configurable monitoring levels per team or role, productivity classification that managers and employees can review together, screenshot blur options for sensitive information, and no personal content capture from communications or documents.
The legal framework supports transparent monitoring. Under the Electronic Communications Privacy Act (ECPA) in the US, employer monitoring on company devices with notice is lawful. The EU General Data Protection Regulation (GDPR) permits workplace monitoring when it serves a legitimate business interest and employees are informed. The key requirement in both frameworks is transparency. When organizations deploy monitoring openly and share data with employees, they satisfy both legal requirements and employee expectations.
The Productivity Visibility Gap Is a Choice
The productivity visibility gap exists because organizations have not invested in systems that make work visible. The 87% vs. 12% perception gap is not inevitable. It is the predictable result of managing knowledge work without knowledge of how that work happens.
Every week the productivity visibility gap persists, it compounds. Disengaged employees go unnoticed. High performers burn out without warning. Managers schedule more meetings. Employees grow more resentful. Leaders consider RTO mandates that do not solve the problem but do drive attrition. The cycle feeds itself.
Closing the gap starts with a decision: replace assumptions with data. Workforce analytics platforms like eMonitor provide the activity data, productivity scoring, and shared dashboards that transform the manager-employee relationship from one built on suspicion to one built on evidence. The 75-point perception gap between leaders and employees does not have to exist. The data to close it is available today.
See How Your Team Actually Works
eMonitor gives you the workforce visibility to close the productivity gap, build trust, and make data-backed decisions. Rated 4.8/5 on Capterra by 1,000+ organizations.
Frequently Asked Questions About the Productivity Visibility Gap
What is the productivity visibility gap?
The productivity visibility gap is the measurable disconnect between how employees perceive their own productivity and what leaders can actually observe about work output. Microsoft's 2022 Work Trend Index found that 87% of employees report being productive, while only 12% of leaders feel confident their teams are productive. This gap creates misaligned priorities, wasted resources, and broken trust.
Why do leaders and employees disagree about productivity?
Leaders and employees disagree about productivity because they measure different things. Employees track effort, task completion, and hours worked. Leaders look for visible output, project milestones, and business outcomes. Without shared data connecting daily activity to results, both sides operate on assumptions. Remote and hybrid work widens this perception gap further.
How does monitoring close the productivity visibility gap?
Workforce monitoring software closes the productivity visibility gap by collecting objective activity data: app usage, time allocation, idle periods, and task progress. eMonitor transforms this data into productivity scores, time heatmaps, and trend reports that both managers and employees can see. Shared visibility replaces assumptions with evidence.
What is the cost of no workforce visibility?
No workforce visibility costs organizations between $4,700 and $14,900 per employee annually through undetected disengagement, misallocated workloads, and delayed intervention. Gallup estimates actively disengaged employees cost the US economy $1.9 trillion in lost productivity per year. The financial impact scales with team size and compounds over time.
Does closing the visibility gap require surveillance?
Closing the productivity visibility gap does not require surveillance. The goal is shared visibility, not covert monitoring. eMonitor provides employee-facing dashboards where individuals see their own productivity scores, time allocation, and activity summaries. Transparency turns monitoring into a self-improvement tool rather than an oversight mechanism.
What does the Microsoft Work Trend Index say about productivity paranoia?
Microsoft's 2022 Work Trend Index coined the term "productivity paranoia" to describe leaders' fear that remote employees are not working, despite evidence that work hours and output have increased. The report found 87% of employees say they are productive, but only 12% of leaders have full confidence their teams are productive.
How does the visibility gap affect employee retention?
The productivity visibility gap damages retention from both directions. High performers leave when their contributions go unrecognized because leaders lack data to see output. Disengaged employees stay undetected for months without early warning systems. Gallup data shows teams with strong manager-employee alignment have 59% lower turnover rates.
Can workforce analytics help with hybrid team management?
Workforce analytics directly addresses hybrid management challenges by providing consistent performance data regardless of employee location. eMonitor tracks app usage, time allocation, and productivity patterns identically for remote, in-office, and hybrid employees. This prevents proximity bias, where managers unconsciously favor employees they see in person.
What are the signs of a productivity visibility gap in an organization?
Common signs include managers requesting frequent status updates, leadership defaulting to return-to-office mandates, high performers feeling unrecognized, persistent disagreement over workload distribution, delayed identification of underperformance, and teams where perceived productivity does not correlate with actual business outcomes.
How quickly can workforce monitoring tools close the visibility gap?
eMonitor generates usable workforce visibility data within the first week of deployment. Initial productivity baselines form after 5 to 7 business days. Meaningful trend data, including workload patterns and engagement signals, emerges within 30 days. Most organizations report confident decision-making from workforce analytics within 60 days of implementation.
Sources
- Microsoft, "Work Trend Index: Annual Report," 2022
- Microsoft, "Work Trend Index: Annual Report," 2023
- Gallup, "State of the Global Workplace," 2024
- Asana, "Anatomy of Work Index," 2024
- SHRM, "Manager Perceptions of Remote Workers," 2023
- Harvard Business Review, "The Real Productivity Crisis," January 2024
- Deloitte, "Workplace Burnout Survey," 2023
- McKinsey, "The State of Organizations," 2023
- Paul J. Zak, "The Neuroscience of Trust," Harvard Business Review, 2017
- Trinity Solutions, "Micromanagement Survey," 2023
- Yuye Ding and Mark Ma, "Return-to-Office Mandates," University of Pittsburgh, 2024
- American Psychological Association, "Time Perception and Self-Report Accuracy," 2021
- American Payroll Association, payroll cost data
- Gartner, "Digital Workplace Survey," 2024